| Map | Pie | Office | Total | D | R | I | Margin | %Margin | Dem | Rep | Ind | Oth. | Dem | Rep | Ind | Other | | | | | | | | | | | | | | | | | | |
|---|
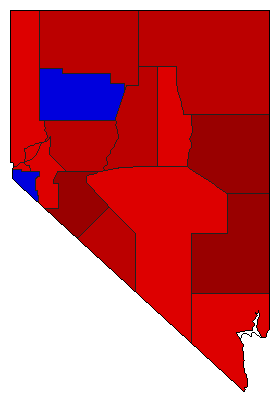 |  | Senator |
61,762 |
1 |
2 |
0 |
9,896 |
16.02% |
58.01% |
41.99% |
0.00% |
0.00% |
35,829 |
25,933 |
0 |
0 |
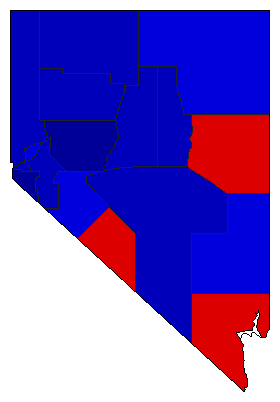 |  | Governor |
61,773 |
2 |
1 |
0 |
9,445 |
15.29% |
42.36% |
57.64% |
0.00% |
0.00% |
26,164 |
35,609 |
0 |
0 |
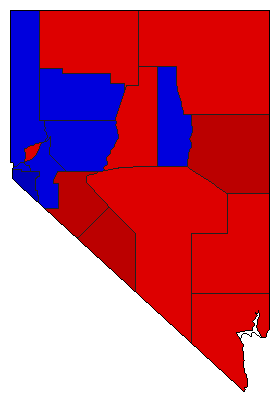 |  | Lt. Governor |
60,927 |
1 |
2 |
0 |
1,785 |
2.93% |
51.46% |
48.54% |
0.00% |
0.00% |
31,356 |
29,571 |
0 |
0 |
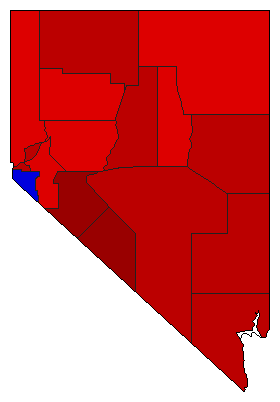 |  | Secretary of State |
59,446 |
1 |
2 |
0 |
11,088 |
18.65% |
59.33% |
40.67% |
0.00% |
0.00% |
35,267 |
24,179 |
0 |
0 |
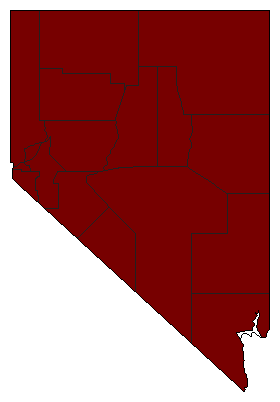 |  | State Treasurer |
36,927 |
1 |
0 |
0 |
36,927 |
100.00% |
100.00% |
0.00% |
0.00% |
0.00% |
36,927 |
0 |
0 |
0 |
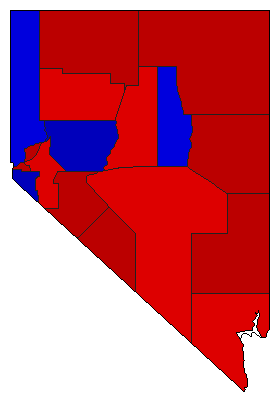 |  | Attorney General |
58,794 |
1 |
2 |
0 |
6,408 |
10.90% |
55.45% |
44.55% |
0.00% |
0.00% |
32,601 |
26,193 |
0 |
0 |
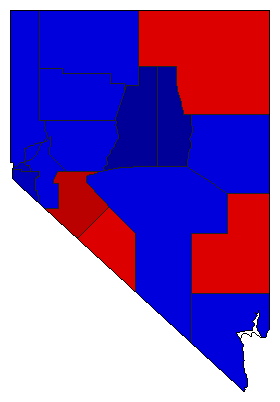 |  | Controller |
59,266 |
2 |
1 |
0 |
6,020 |
10.16% |
44.92% |
55.08% |
0.00% |
0.00% |
26,623 |
32,643 |
0 |
0 |
|