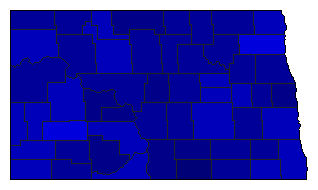
1950 General Election Results Comparison - North Dakota
| Map | Pie | Office | Total | D | R | I | Margin | %Margin | Dem | Rep | Ind | Oth. | Dem | Rep | Ind | Other |
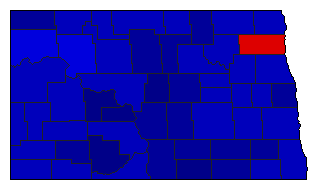 | Senator | 186,716 | 2 | 1 | 0 | 65,702 | 35.19% | 32.41% | 67.59% | 0.00% | 0.00% | 60,507 | 126,209 | 0 | 0 | |
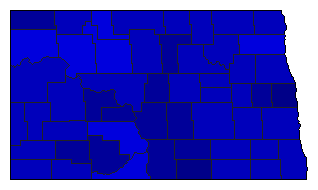 | Governor | 183,772 | 2 | 1 | 0 | 59,872 | 32.58% | 33.71% | 66.29% | 0.00% | 0.00% | 61,950 | 121,822 | 0 | 0 | |
 |  | Lt. Governor | 176,489 | 2 | 1 | 0 | 79,333 | 44.95% | 27.52% | 72.48% | 0.00% | 0.00% | 48,578 | 127,911 | 0 | 0 |
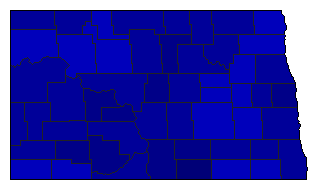 |  | Secretary of State | 176,580 | 2 | 1 | 0 | 79,320 | 44.92% | 27.54% | 72.46% | 0.00% | 0.00% | 48,630 | 127,950 | 0 | 0 |
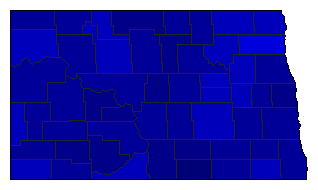 |  | State Treasurer | 176,186 | 2 | 1 | 0 | 80,914 | 45.93% | 27.04% | 72.96% | 0.00% | 0.00% | 47,636 | 128,550 | 0 | 0 |
 |  | Attorney General | 173,638 | 2 | 1 | 0 | 75,838 | 43.68% | 28.16% | 71.84% | 0.00% | 0.00% | 48,900 | 124,738 | 0 | 0 |
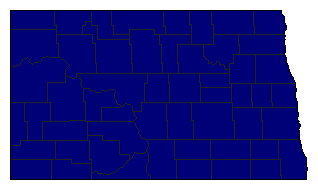 |  | State Auditor | 150,385 | 0 | 1 | 0 | 150,385 | 100.00% | 0.00% | 100.00% | 0.00% | 0.00% | 0 | 150,385 | 0 | 0 |
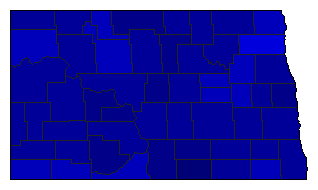 |  | Insurance Commissioner | 170,863 | 2 | 1 | 0 | 78,197 | 45.77% | 27.12% | 72.88% | 0.00% | 0.00% | 46,333 | 124,530 | 0 | 0 |
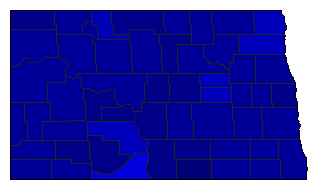 |  | Agriculture Commissioner | 178,373 | 2 | 1 | 0 | 92,863 | 52.06% | 23.97% | 76.03% | 0.00% | 0.00% | 42,755 | 135,618 | 0 | 0 |
North Dakota Results for 1950
Login
© Dave Leip's Atlas of U.S. Elections, LLC 2019 All Rights Reserved
Note: The advertisement links below may advocate political positions that this site does not endorse.
Login
© Dave Leip's Atlas of U.S. Elections, LLC 2019 All Rights Reserved
Note: The advertisement links below may advocate political positions that this site does not endorse.