| Map | Pie | Office | Total | D | R | I | Margin | %Margin | Dem | Rep | Ind | Oth. | Dem | Rep | Ind | Other | | | | | | | | | | | | | | | | | | |
|---|
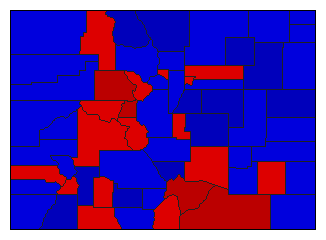
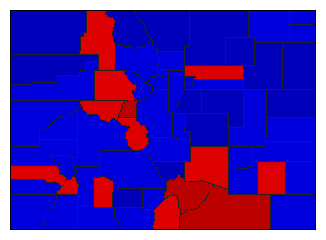 |  | Senator |
450,176 |
2 |
1 |
0 |
29,292 |
6.51% |
46.75% |
53.25% |
0.00% |
0.00% |
210,442 |
239,734 |
0 |
0 |
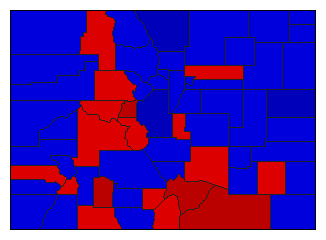
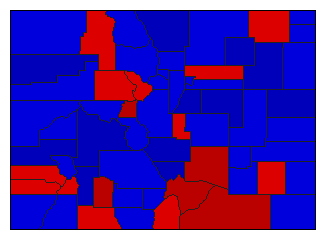 |  | Governor |
450,994 |
2 |
1 |
0 |
23,496 |
5.21% |
47.22% |
52.43% |
0.00% |
0.34% |
212,976 |
236,472 |
0 |
1,546 |
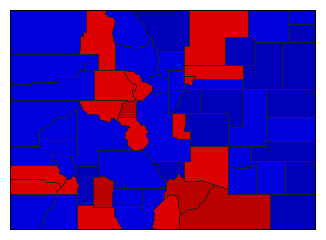 |  | Lt. Governor |
434,403 |
2 |
1 |
0 |
20,031 |
4.61% |
47.69% |
52.31% |
0.00% |
0.00% |
207,186 |
227,217 |
0 |
0 |
 |  | Secretary of State |
436,097 |
1 |
2 |
0 |
7,605 |
1.74% |
50.87% |
49.13% |
0.00% |
0.00% |
221,851 |
214,246 |
0 |
0 |
 |  | State Treasurer |
431,343 |
2 |
1 |
0 |
7,823 |
1.81% |
49.09% |
50.91% |
0.00% |
0.00% |
211,760 |
219,583 |
0 |
0 |
 |  | Attorney General |
437,682 |
2 |
1 |
0 |
13,512 |
3.09% |
48.46% |
51.54% |
0.00% |
0.00% |
212,085 |
225,597 |
0 |
0 |
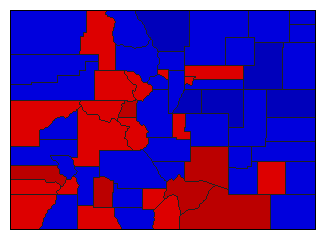
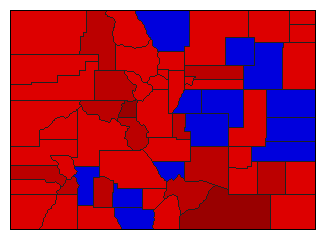 |  | State Auditor |
435,629 |
1 |
2 |
0 |
50,313 |
11.55% |
55.77% |
44.23% |
0.00% |
0.00% |
242,971 |
192,658 |
0 |
0 |
|
