1952 General Election Results Comparison - Illinois
| Map | Pie | Office | Total | D | R | I | Margin | %Margin | Dem | Rep | Ind | Oth. | Dem | Rep | Ind | Other |
 | 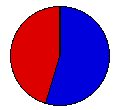 | President | 4,481,058 | 2 | 1 | - | 443,407 | 9.90% | 44.94% | 54.84% | 0.00% | 0.22% | 2,013,920 | 2,457,327 | 0 | 9,811 |
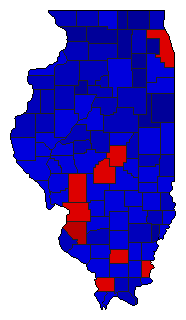 | Governor | 4,415,864 | 2 | 1 | 0 | 227,642 | 5.16% | 47.32% | 52.48% | 0.00% | 0.20% | 2,089,721 | 2,317,363 | 0 | 8,780 | |
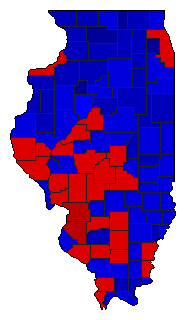 | Secretary of State | 4,391,212 | 2 | 1 | 0 | 9,303 | 0.21% | 49.80% | 50.02% | 0.00% | 0.18% | 2,187,024 | 2,196,327 | 0 | 7,861 |
Illinois Results for 1952
Login
© Dave Leip's Atlas of U.S. Elections, LLC 2019 All Rights Reserved
Note: The advertisement links below may advocate political positions that this site does not endorse.
Login
© Dave Leip's Atlas of U.S. Elections, LLC 2019 All Rights Reserved
Note: The advertisement links below may advocate political positions that this site does not endorse.