| Map | Pie | Office | Total | D | R | I | Margin | %Margin | Dem | Rep | Ind | Oth. | Dem | Rep | Ind | Other | | | | | | | | | | | | | | | | | | |
|---|
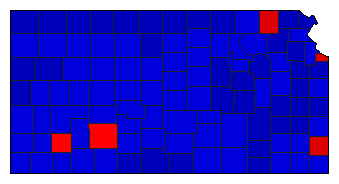
 |  | President |
896,166 |
2 |
1 |
- |
343,006 |
38.27% |
30.50% |
68.77% |
0.00% |
0.73% |
273,296 |
616,302 |
0 |
6,568 |
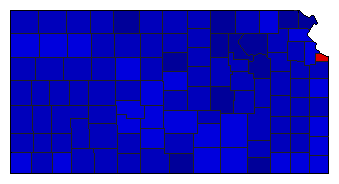
 |  | Governor |
872,139 |
2 |
1 |
0 |
127,856 |
14.66% |
41.68% |
56.34% |
0.00% |
1.99% |
363,482 |
491,338 |
0 |
17,319 |
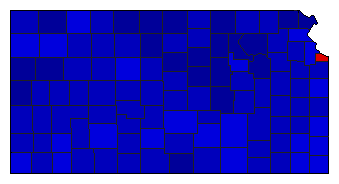
 |  | Lt. Governor |
829,897 |
2 |
1 |
0 |
191,489 |
23.07% |
37.27% |
60.34% |
0.00% |
2.39% |
309,280 |
500,769 |
0 |
19,848 |
 |  | Secretary of State |
812,402 |
2 |
1 |
0 |
194,780 |
23.98% |
36.72% |
60.70% |
0.00% |
2.58% |
298,315 |
493,095 |
0 |
20,992 |
 |  | State Treasurer |
803,295 |
2 |
1 |
0 |
171,723 |
21.38% |
38.16% |
59.54% |
0.00% |
2.31% |
306,519 |
478,242 |
0 |
18,534 |
 |  | Attorney General |
806,497 |
2 |
1 |
0 |
128,777 |
15.97% |
42.02% |
57.98% |
0.00% |
0.00% |
338,860 |
467,637 |
0 |
0 |
 |  | State Auditor |
809,038 |
2 |
1 |
0 |
177,271 |
21.91% |
37.87% |
59.78% |
0.00% |
2.35% |
306,396 |
483,667 |
0 |
18,975 |
 |  | Insurance Commissioner |
795,300 |
2 |
1 |
0 |
157,585 |
19.81% |
39.04% |
58.85% |
0.00% |
2.11% |
310,471 |
468,056 |
0 |
16,773 |
|
