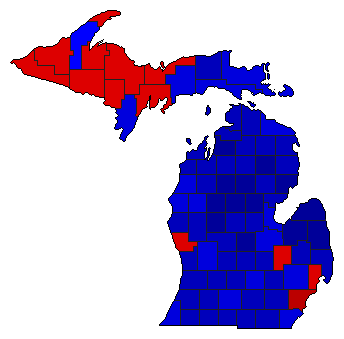
| Map | Pie | Office | Total | D | R | I | Margin | %Margin | Dem | Rep | Ind | Oth. | Dem | Rep | Ind | Other | | | | | | | | | | | | | | | | | | |
|---|
 | 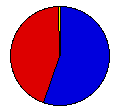 | President |
2,798,592 |
2 |
1 |
- |
320,872 |
11.47% |
43.97% |
55.44% |
0.00% |
0.59% |
1,230,657 |
1,551,529 |
0 |
16,406 |
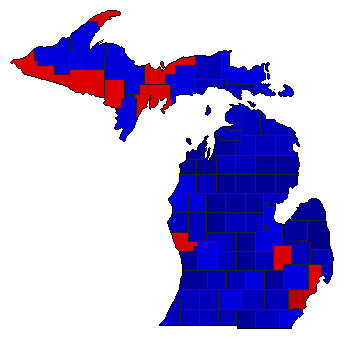
 | | Senator |
2,821,133 |
2 |
1 |
3 |
44,936 |
1.59% |
49.04% |
50.63% |
0.26% |
0.07% |
1,383,416 |
1,428,352 |
7,435 |
1,930 |
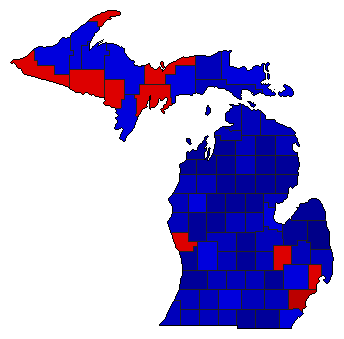
 | | Governor |
2,865,980 |
1 |
2 |
3 |
8,618 |
0.30% |
49.96% |
49.66% |
0.31% |
0.06% |
1,431,893 |
1,423,275 |
8,990 |
1,822 |
 | | Lt. Governor |
2,781,140 |
2 |
1 |
3 |
89,212 |
3.21% |
48.23% |
51.44% |
0.29% |
0.05% |
1,341,298 |
1,430,510 |
7,947 |
1,385 |
 | | Secretary of State |
2,771,810 |
2 |
1 |
3 |
133,975 |
4.83% |
47.35% |
52.18% |
0.28% |
0.19% |
1,312,373 |
1,446,348 |
7,748 |
5,341 |
 | | State Treasurer |
2,766,954 |
2 |
1 |
3 |
146,582 |
5.30% |
47.12% |
52.42% |
0.28% |
0.18% |
1,303,755 |
1,450,337 |
7,784 |
5,078 |
 | | Attorney General |
2,765,921 |
2 |
1 |
3 |
169,944 |
6.14% |
46.76% |
52.91% |
0.28% |
0.05% |
1,293,426 |
1,463,370 |
7,704 |
1,421 |
 | | State Auditor |
2,762,362 |
2 |
1 |
3 |
169,320 |
6.13% |
46.77% |
52.90% |
0.28% |
0.05% |
1,291,880 |
1,461,200 |
7,861 |
1,421 |
|
