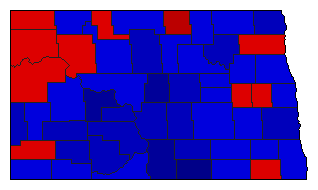
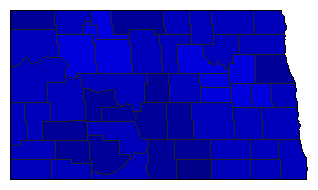
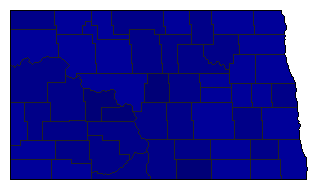
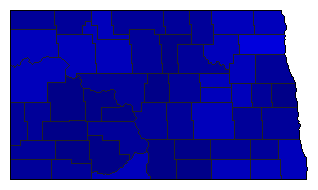
Lt. Gubernatorial General Election Results Comparison - North Dakota
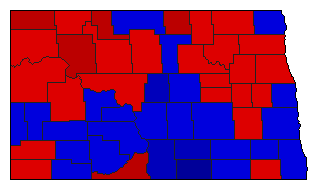
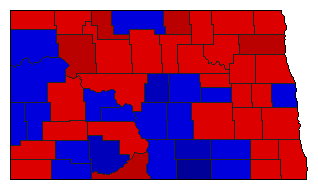
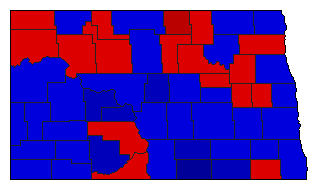
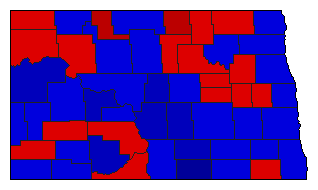
| Map | Pie | Year | Total | D | R | I | Margin | %Margin | Dem | Rep | Ind | Oth. | Dem | Rep | Ind | Other |
 |  | 1972 | 265,162 | 1 | 2 | 0 | 1,724 | 0.65% | 50.33% | 49.67% | 0.00% | 0.00% | 133,443 | 131,719 | 0 | 0 |
 |  | 1968 | 233,947 | 2 | 1 | 0 | 13,206 | 5.64% | 46.44% | 52.09% | 0.00% | 1.47% | 108,647 | 121,853 | 0 | 3,447 |
 |  | 1964 | 244,572 | 1 | 2 | 0 | 8,680 | 3.55% | 51.77% | 48.23% | 0.00% | 0.00% | 126,626 | 117,946 | 0 | 0 |
 |  | 1962 | 213,053 | 2 | 1 | 0 | 12,355 | 5.80% | 47.10% | 52.90% | 0.00% | 0.00% | 100,349 | 112,704 | 0 | 0 |
 |  | 1960 | 257,753 | 2 | 1 | 0 | 12,977 | 5.03% | 47.48% | 52.52% | 0.00% | 0.00% | 122,388 | 135,365 | 0 | 0 |
 |  | 1958 | 200,014 | 2 | 1 | 0 | 20,804 | 10.40% | 44.80% | 55.20% | 0.00% | 0.00% | 89,605 | 110,409 | 0 | 0 |
 |  | 1956 | 237,584 | 2 | 1 | 0 | 38,814 | 16.34% | 41.83% | 58.17% | 0.00% | 0.00% | 99,385 | 138,199 | 0 | 0 |
 |  | 1954 | 185,047 | 2 | 1 | 0 | 59,305 | 32.05% | 33.98% | 66.02% | 0.00% | 0.00% | 62,871 | 122,176 | 0 | 0 |
 |  | 1952 | 237,656 | 2 | 1 | 0 | 141,336 | 59.47% | 20.26% | 79.74% | 0.00% | 0.00% | 48,160 | 189,496 | 0 | 0 |
 |  | 1950 | 176,489 | 2 | 1 | 0 | 79,333 | 44.95% | 27.52% | 72.48% | 0.00% | 0.00% | 48,578 | 127,911 | 0 | 0 |
 |  | 1918 | 84,847 | 2 | 1 | 0 | 20,151 | 23.75% | 38.13% | 61.87% | 0.00% | 0.00% | 32,348 | 52,499 | 0 | 0 |
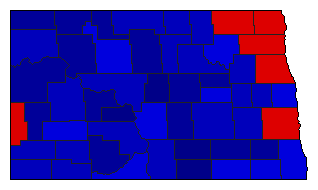
North Dakota Results for 1952
Login
© Dave Leip's Atlas of U.S. Elections, LLC 2019 All Rights Reserved
Note: The advertisement links below may advocate political positions that this site does not endorse.
Login
© Dave Leip's Atlas of U.S. Elections, LLC 2019 All Rights Reserved
Note: The advertisement links below may advocate political positions that this site does not endorse.