1952 General Election Results Comparison - Oregon
| Map | Pie | Office | Total | D | R | I | Margin | %Margin | Dem | Rep | Ind | Oth. | Dem | Rep | Ind | Other |
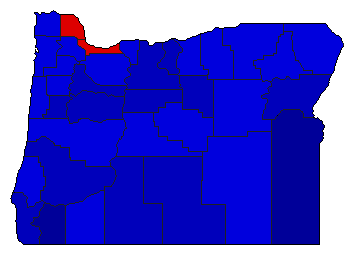
 |  | President | 695,059 | 2 | 1 | - | 150,236 | 21.61% | 38.93% | 60.54% | 0.00% | 0.53% | 270,579 | 420,815 | 0 | 3,665 |
 |  | Secretary of State | 672,110 | 2 | 1 | 0 | 68,322 | 10.17% | 44.92% | 55.08% | 0.00% | 0.00% | 301,894 | 370,216 | 0 | 0 |
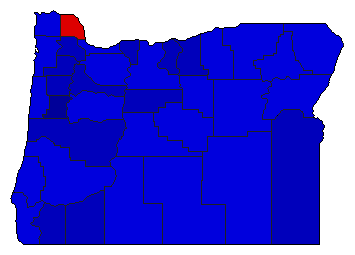 |  | State Treasurer | 649,934 | 2 | 1 | 0 | 108,282 | 16.66% | 41.67% | 58.33% | 0.00% | 0.00% | 270,826 | 379,108 | 0 | 0 |
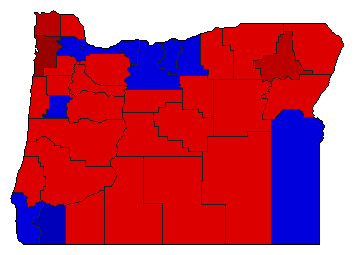 |  | Attorney General | 639,784 | 1 | 2 | 0 | 13,844 | 2.16% | 51.08% | 48.92% | 0.00% | 0.00% | 326,814 | 312,970 | 0 | 0 |
Oregon Results for 1952
Login
© Dave Leip's Atlas of U.S. Elections, LLC 2019 All Rights Reserved
Note: The advertisement links below may advocate political positions that this site does not endorse.
Login
© Dave Leip's Atlas of U.S. Elections, LLC 2019 All Rights Reserved
Note: The advertisement links below may advocate political positions that this site does not endorse.