1952 General Election Results Comparison - Pennsylvania
| Map | Pie | Office | Total | D | R | I | Margin | %Margin | Dem | Rep | Ind | Oth. | Dem | Rep | Ind | Other |
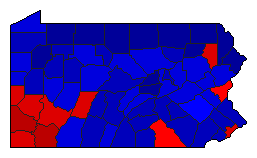
 |  | President | 4,580,969 | 2 | 1 | - | 269,520 | 5.88% | 46.85% | 52.74% | 0.00% | 0.41% | 2,146,269 | 2,415,789 | 0 | 18,911 |
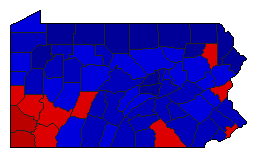
 |  | Senator | 4,519,761 | 2 | 1 | 0 | 162,488 | 3.60% | 47.98% | 51.57% | 0.00% | 0.45% | 2,168,546 | 2,331,034 | 0 | 20,181 |
 |  | State Treasurer | 4,481,794 | 2 | 1 | 0 | 189,910 | 4.24% | 47.82% | 52.06% | 0.00% | 0.12% | 2,143,169 | 2,333,079 | 0 | 5,546 |
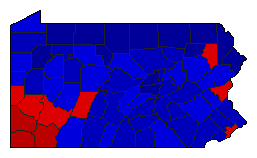 |  | State Auditor | 4,490,187 | 2 | 1 | 0 | 214,286 | 4.77% | 47.55% | 52.32% | 0.00% | 0.13% | 2,135,027 | 2,349,313 | 0 | 5,847 |
Pennsylvania Results for 1952
Login
© Dave Leip's Atlas of U.S. Elections, LLC 2019 All Rights Reserved
Note: The advertisement links below may advocate political positions that this site does not endorse.
Login
© Dave Leip's Atlas of U.S. Elections, LLC 2019 All Rights Reserved
Note: The advertisement links below may advocate political positions that this site does not endorse.