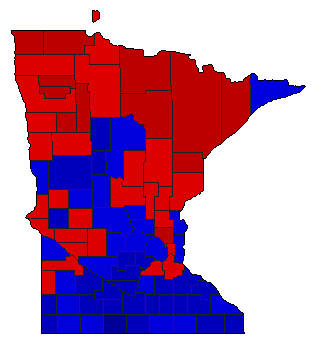
1954 General Election Results Comparison - Minnesota
| Map | Pie | Office | Total | D | R | I | Margin | %Margin | Dem | Rep | Ind | Oth. | Dem | Rep | Ind | Other |
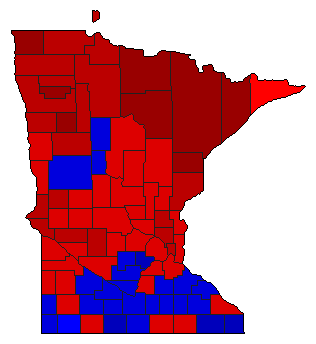 |  | Senator | 1,138,952 | 1 | 2 | 0 | 162,574 | 14.27% | 56.38% | 42.11% | 0.00% | 1.50% | 642,193 | 479,619 | 0 | 17,140 |
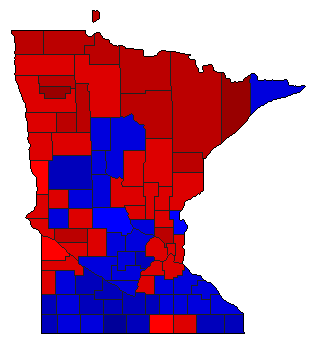 | Governor | 1,151,417 | 1 | 2 | 3 | 68,234 | 5.93% | 52.73% | 46.80% | 0.47% | 0.00% | 607,099 | 538,865 | 5,453 | 0 | |
 |  | Lt. Governor | 1,118,889 | 1 | 2 | 0 | 54,001 | 4.83% | 52.41% | 47.59% | 0.00% | 0.00% | 586,445 | 532,444 | 0 | 0 |
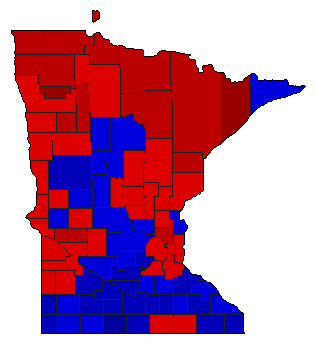
 |  | Secretary of State | 1,137,513 | 1 | 2 | 0 | 37,205 | 3.27% | 51.64% | 48.36% | 0.00% | 0.00% | 587,359 | 550,154 | 0 | 0 |
 |  | State Treasurer | 1,114,045 | 1 | 2 | 0 | 63,205 | 5.67% | 52.84% | 47.16% | 0.00% | 0.00% | 588,625 | 525,420 | 0 | 0 |
 |  | Attorney General | 1,114,647 | 1 | 2 | 0 | 61,125 | 5.48% | 52.74% | 47.26% | 0.00% | 0.00% | 587,886 | 526,761 | 0 | 0 |
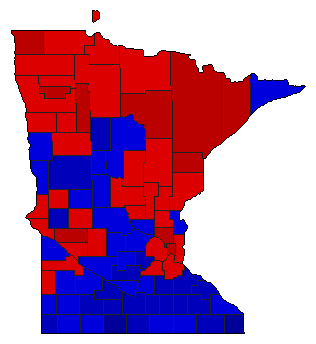
 |  | State Auditor | 1,120,579 | 2 | 1 | 0 | 13,691 | 1.22% | 49.39% | 50.61% | 0.00% | 0.00% | 553,444 | 567,135 | 0 | 0 |
Minnesota Results for 1954
Login
© Dave Leip's Atlas of U.S. Elections, LLC 2019 All Rights Reserved
Note: The advertisement links below may advocate political positions that this site does not endorse.
Login
© Dave Leip's Atlas of U.S. Elections, LLC 2019 All Rights Reserved
Note: The advertisement links below may advocate political positions that this site does not endorse.