1956 General Election Results Comparison - Minnesota
| Map | Pie | Office | Total | D | R | I | Margin | %Margin | Dem | Rep | Ind | Oth. | Dem | Rep | Ind | Other |
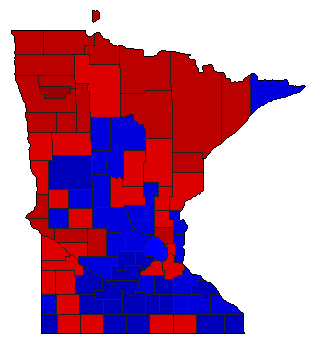
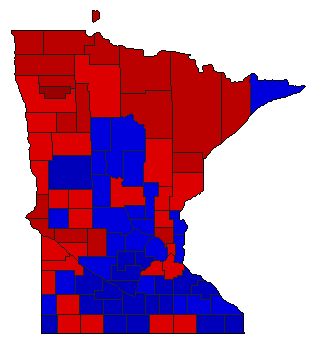
 |  | President | 1,340,005 | 2 | 1 | 0 | 101,777 | 7.60% | 46.08% | 53.68% | 0.00% | 0.24% | 617,525 | 719,302 | 0 | 3,178 |
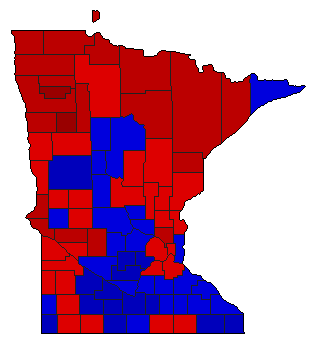
 | Governor | 1,422,161 | 1 | 2 | 3 | 45,984 | 3.23% | 51.41% | 48.18% | 0.41% | 0.00% | 731,180 | 685,196 | 5,785 | 0 | |
 |  | Lt. Governor | 1,379,152 | 1 | 2 | 0 | 72,446 | 5.25% | 52.63% | 47.37% | 0.00% | 0.00% | 725,799 | 653,353 | 0 | 0 |
 |  | Secretary of State | 1,394,017 | 1 | 2 | 0 | 53,461 | 3.84% | 51.92% | 48.08% | 0.00% | 0.00% | 723,739 | 670,278 | 0 | 0 |
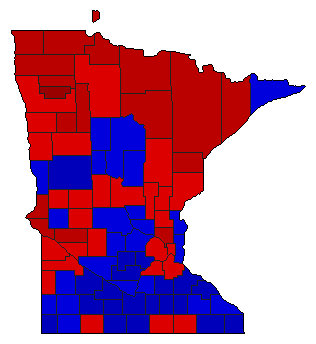
 |  | State Treasurer | 1,384,354 | 2 | 1 | 0 | 3,790 | 0.27% | 49.86% | 50.14% | 0.00% | 0.00% | 690,282 | 694,072 | 0 | 0 |
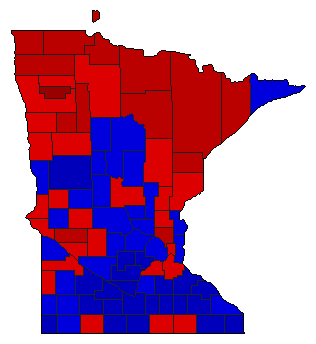
 |  | Attorney General | 1,383,625 | 1 | 2 | 0 | 5,763 | 0.42% | 50.21% | 49.79% | 0.00% | 0.00% | 694,694 | 688,931 | 0 | 0 |
Minnesota Results for 1956
Login
© Dave Leip's Atlas of U.S. Elections, LLC 2019 All Rights Reserved
Note: The advertisement links below may advocate political positions that this site does not endorse.
Login
© Dave Leip's Atlas of U.S. Elections, LLC 2019 All Rights Reserved
Note: The advertisement links below may advocate political positions that this site does not endorse.