| Map | Pie | Office | Total | D | R | I | Margin | %Margin | Dem | Rep | Ind | Oth. | Dem | Rep | Ind | Other | | | | | | | | | | | | | | | | | | |
|---|
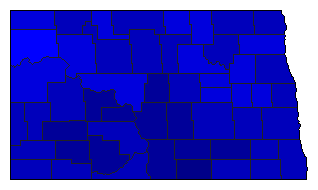
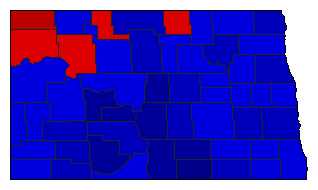
 |  | President |
253,991 |
2 |
1 |
0 |
60,024 |
23.63% |
38.09% |
61.72% |
0.00% |
0.19% |
96,742 |
156,766 |
0 |
483 |
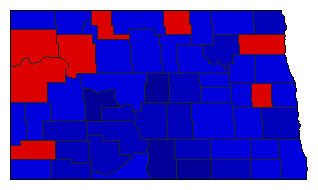
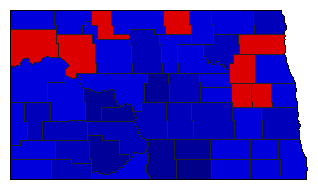
 | | Senator |
244,161 |
2 |
1 |
3 |
67,386 |
27.60% |
36.01% |
63.61% |
0.38% |
0.00% |
87,919 |
155,305 |
937 |
0 |
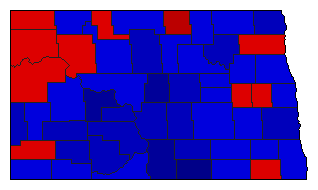
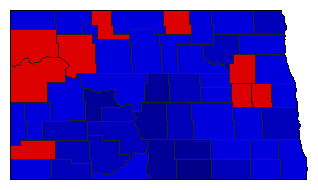
 | | Governor |
252,435 |
2 |
1 |
0 |
42,697 |
16.91% |
41.54% |
58.46% |
0.00% |
0.00% |
104,869 |
147,566 |
0 |
0 |
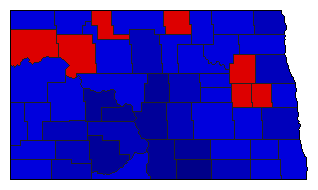
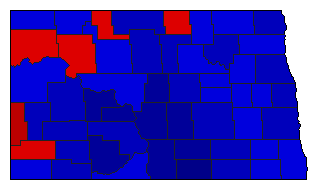
 |  | Lt. Governor |
237,584 |
2 |
1 |
0 |
38,814 |
16.34% |
41.83% |
58.17% |
0.00% |
0.00% |
99,385 |
138,199 |
0 |
0 |
 |  | Secretary of State |
234,872 |
2 |
1 |
0 |
48,066 |
20.46% |
39.77% |
60.23% |
0.00% |
0.00% |
93,403 |
141,469 |
0 |
0 |
 |  | State Treasurer |
234,808 |
2 |
1 |
0 |
48,398 |
20.61% |
39.69% |
60.31% |
0.00% |
0.00% |
93,205 |
141,603 |
0 |
0 |
 |  | Attorney General |
235,668 |
2 |
1 |
0 |
45,172 |
19.17% |
40.42% |
59.58% |
0.00% |
0.00% |
95,248 |
140,420 |
0 |
0 |
 |  | State Auditor |
234,528 |
2 |
1 |
0 |
40,374 |
17.22% |
41.39% |
58.61% |
0.00% |
0.00% |
97,077 |
137,451 |
0 |
0 |
 |  | Insurance Commissioner |
232,538 |
2 |
1 |
0 |
50,596 |
21.76% |
39.12% |
60.88% |
0.00% |
0.00% |
90,971 |
141,567 |
0 |
0 |
 |  | Agriculture Commissioner |
238,756 |
2 |
1 |
0 |
54,338 |
22.76% |
38.62% |
61.38% |
0.00% |
0.00% |
92,209 |
146,547 |
0 |
0 |
|
