Note: The Google advertisement links below may advocate political positions that this site does not endorse.
| Map | Pie | Office | Total | D | R | I | Margin | %Margin | Dem | Rep | Ind | Oth. | Dem | Rep | Ind | Other | | | | | | | | | | | | | | | | | | |
|---|
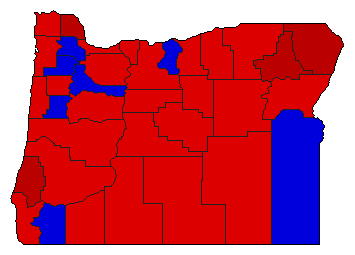
 |  | President |
735,597 |
2 |
1 |
0 |
77,189 |
10.49% |
44.75% |
55.25% |
0.00% |
0.00% |
329,204 |
406,393 |
0 |
0 |
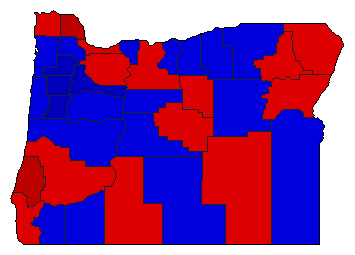
 | | Senator |
732,254 |
1 |
2 |
0 |
61,444 |
8.39% |
54.20% |
45.80% |
0.00% |
0.00% |
396,849 |
335,405 |
0 |
0 |
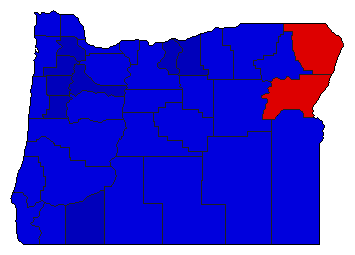
 | | Governor |
731,279 |
1 |
2 |
0 |
7,599 |
1.04% |
50.52% |
49.48% |
0.00% |
0.00% |
369,439 |
361,840 |
0 |
0 |
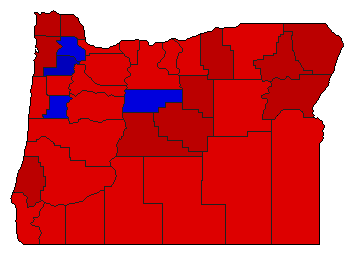
 |  | Secretary of State |
717,611 |
2 |
1 |
0 |
18,643 |
2.60% |
48.70% |
51.30% |
0.00% |
0.00% |
349,484 |
368,127 |
0 |
0 |
 |  | State Treasurer |
712,401 |
2 |
1 |
0 |
120,419 |
16.90% |
41.55% |
58.45% |
0.00% |
0.00% |
295,991 |
416,410 |
0 |
0 |
 |  | Attorney General |
702,105 |
1 |
2 |
0 |
56,123 |
7.99% |
54.00% |
46.00% |
0.00% |
0.00% |
379,114 |
322,991 |
0 |
0 |
|
