| Map | Pie | Office | Total | D | R | I | Margin | %Margin | Dem | Rep | Ind | Oth. | Dem | Rep | Ind | Other | | | | | | | | | | | | | | | | | | |
|---|
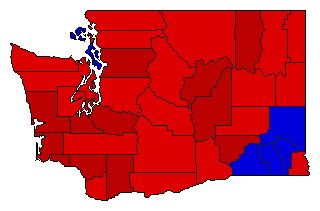
 |  | President |
1,150,889 |
2 |
1 |
0 |
97,428 |
8.47% |
45.44% |
53.91% |
0.00% |
0.65% |
523,002 |
620,430 |
0 |
7,457 |
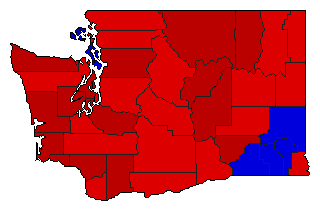
 | | Senator |
1,122,217 |
1 |
2 |
0 |
248,913 |
22.18% |
61.09% |
38.91% |
0.00% |
0.00% |
685,565 |
436,652 |
0 |
0 |
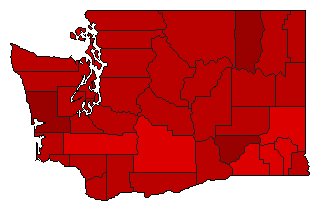
 | | Governor |
1,128,977 |
1 |
2 |
0 |
108,732 |
9.63% |
54.63% |
45.00% |
0.00% |
0.37% |
616,773 |
508,041 |
0 |
4,163 |
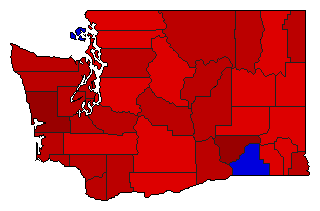
 | | Lt. Governor |
1,060,250 |
1 |
2 |
0 |
99,276 |
9.36% |
54.68% |
45.32% |
0.00% |
0.00% |
579,763 |
480,487 |
0 |
0 |
 | | Secretary of State |
1,054,864 |
1 |
2 |
0 |
23,588 |
2.24% |
51.12% |
48.88% |
0.00% |
0.00% |
539,226 |
515,638 |
0 |
0 |
 | | State Treasurer |
1,029,627 |
1 |
2 |
0 |
102,987 |
10.00% |
55.00% |
45.00% |
0.00% |
0.00% |
566,307 |
463,320 |
0 |
0 |
 | | Attorney General |
1,036,834 |
1 |
2 |
0 |
141,006 |
13.60% |
56.80% |
43.20% |
0.00% |
0.00% |
588,920 |
447,914 |
0 |
0 |
 |  | Comptroller General |
1,034,858 |
1 |
2 |
0 |
182,214 |
17.61% |
58.80% |
41.20% |
0.00% |
0.00% |
608,536 |
426,322 |
0 |
0 |
 | | State Auditor |
1,037,788 |
1 |
2 |
0 |
276,234 |
26.62% |
63.31% |
36.69% |
0.00% |
0.00% |
657,011 |
380,777 |
0 |
0 |
 | | Insurance Commissioner |
1,011,682 |
1 |
2 |
0 |
206,444 |
20.41% |
60.20% |
39.80% |
0.00% |
0.00% |
609,063 |
402,619 |
0 |
0 |
|
