1956 General Election Results Comparison - Colorado
| Map | Pie | Office | Total | D | R | I | Margin | %Margin | Dem | Rep | Ind | Oth. | Dem | Rep | Ind | Other |
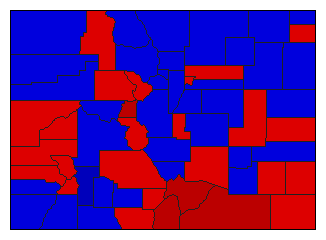
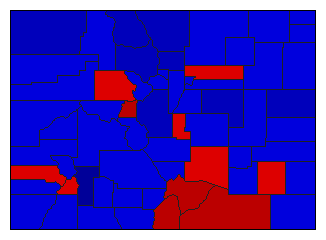
 |  | President | 663,074 | 2 | 1 | 0 | 130,482 | 19.68% | 39.81% | 59.49% | 0.00% | 0.69% | 263,997 | 394,479 | 0 | 4,598 |
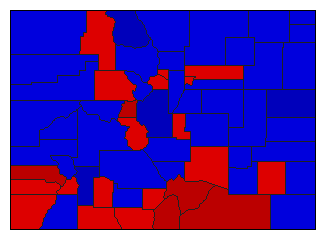
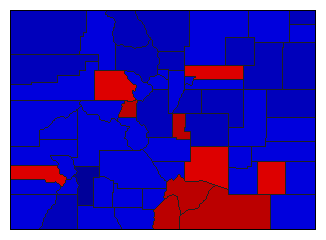
 |  | Senator | 637,074 | 1 | 2 | 0 | 2,670 | 0.42% | 50.21% | 49.79% | 0.00% | 0.00% | 319,872 | 317,202 | 0 | 0 |
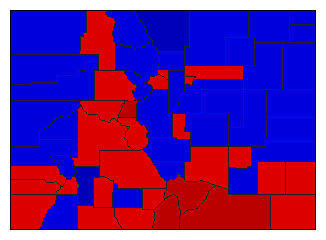
 |  | Governor | 645,233 | 1 | 2 | 0 | 17,333 | 2.69% | 51.34% | 48.66% | 0.00% | 0.00% | 331,283 | 313,950 | 0 | 0 |
 |  | Lt. Governor | 622,106 | 2 | 1 | 0 | 1,946 | 0.31% | 49.84% | 50.16% | 0.00% | 0.00% | 310,080 | 312,026 | 0 | 0 |
 |  | Secretary of State | 601,384 | 1 | 2 | 0 | 12,126 | 2.02% | 51.01% | 48.99% | 0.00% | 0.00% | 306,755 | 294,629 | 0 | 0 |
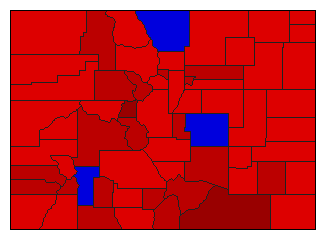 |  | State Treasurer | 603,449 | 1 | 2 | 0 | 98,379 | 16.30% | 58.15% | 41.85% | 0.00% | 0.00% | 350,914 | 252,535 | 0 | 0 |
 |  | Attorney General | 604,142 | 2 | 1 | 0 | 55,202 | 9.14% | 45.43% | 54.57% | 0.00% | 0.00% | 274,470 | 329,672 | 0 | 0 |
 |  | State Auditor | 606,289 | 2 | 1 | 0 | 58,657 | 9.67% | 45.16% | 54.84% | 0.00% | 0.00% | 273,816 | 332,473 | 0 | 0 |
Colorado Results for 1956
Login
© Dave Leip's Atlas of U.S. Elections, LLC 2019 All Rights Reserved
Note: The advertisement links below may advocate political positions that this site does not endorse.
Login
© Dave Leip's Atlas of U.S. Elections, LLC 2019 All Rights Reserved
Note: The advertisement links below may advocate political positions that this site does not endorse.