| Map | Pie | Office | Total | D | R | I | Margin | %Margin | Dem | Rep | Ind | Oth. | Dem | Rep | Ind | Other | | | | | | | | | | | | | | | | | | |
|---|
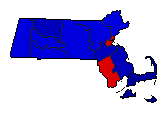
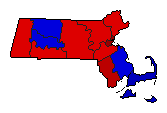
 |  | President |
2,469,480 |
1 |
2 |
0 |
510,424 |
20.67% |
60.22% |
39.55% |
0.00% |
0.22% |
1,487,174 |
976,750 |
0 |
5,556 |
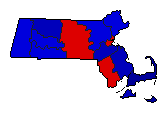
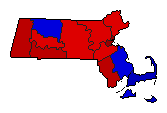
 | | Senator |
2,417,810 |
2 |
1 |
3 |
307,831 |
12.73% |
43.46% |
56.19% |
0.24% |
0.12% |
1,050,725 |
1,358,556 |
5,735 |
2,794 |
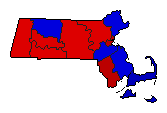
 | | Governor |
2,416,975 |
2 |
1 |
3 |
138,485 |
5.73% |
46.79% |
52.52% |
0.39% |
0.31% |
1,130,810 |
1,269,295 |
9,474 |
7,396 |
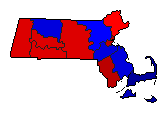
 | | Lt. Governor |
2,343,156 |
1 |
2 |
4 |
208,565 |
8.90% |
54.00% |
45.10% |
0.38% |
0.53% |
1,265,244 |
1,056,679 |
8,853 |
12,380 |
 | | Secretary of State |
2,319,771 |
1 |
2 |
3 |
111,790 |
4.82% |
52.02% |
47.21% |
0.48% |
0.29% |
1,206,844 |
1,095,054 |
11,046 |
6,827 |
 |  | State Treasurer |
2,301,724 |
1 |
2 |
4 |
396,298 |
17.22% |
58.14% |
40.92% |
0.34% |
0.60% |
1,338,202 |
941,904 |
7,846 |
13,772 |
 |  | Attorney General |
2,357,667 |
1 |
2 |
3 |
432,316 |
18.34% |
58.81% |
40.47% |
0.50% |
0.22% |
1,386,452 |
954,136 |
11,839 |
5,240 |
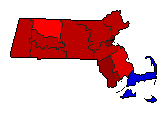 |  | State Auditor |
2,319,121 |
1 |
2 |
4 |
755,993 |
32.60% |
66.00% |
33.41% |
0.25% |
0.34% |
1,530,715 |
774,722 |
5,787 |
7,897 |
|
