1960 General Election Results Comparison - Michigan
| Map | Pie | Office | Total | D | R | I | Margin | %Margin | Dem | Rep | Ind | Oth. | Dem | Rep | Ind | Other |
 |  | President | 3,318,097 | 1 | 2 | 7 | 66,841 | 2.01% | 50.85% | 48.84% | 0.02% | 0.30% | 1,687,269 | 1,620,428 | 539 | 9,861 |
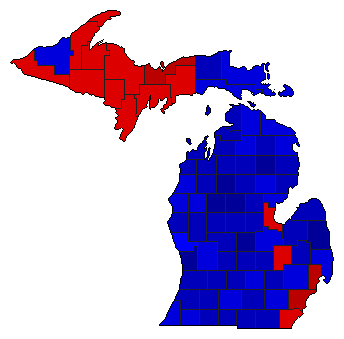 | Senator | 3,226,647 | 1 | 2 | 3 | 120,306 | 3.73% | 51.73% | 48.00% | 0.10% | 0.16% | 1,669,179 | 1,548,873 | 3,282 | 5,313 | |
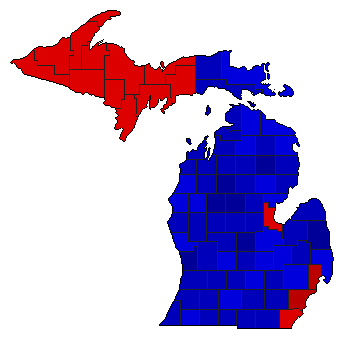 | Governor | 3,255,991 | 1 | 2 | 3 | 41,612 | 1.28% | 50.48% | 49.20% | 0.10% | 0.21% | 1,643,634 | 1,602,022 | 3,387 | 6,948 | |
 | Lt. Governor | 3,204,568 | 1 | 2 | 4 | 74,147 | 2.31% | 50.95% | 48.64% | 0.09% | 0.32% | 1,632,782 | 1,558,635 | 2,967 | 10,184 |
Michigan Results for 1960
Login
© Dave Leip's Atlas of U.S. Elections, LLC 2019 All Rights Reserved
Note: The advertisement links below may advocate political positions that this site does not endorse.
Login
© Dave Leip's Atlas of U.S. Elections, LLC 2019 All Rights Reserved
Note: The advertisement links below may advocate political positions that this site does not endorse.