Lt. Gubernatorial General Election Results Comparison - Michigan
| Map | Pie | Year | Total | D | R | I | Margin | %Margin | Dem | Rep | Ind | Oth. | Dem | Rep | Ind | Other |
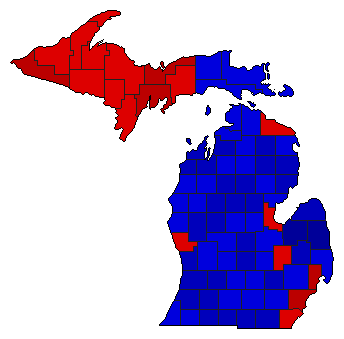
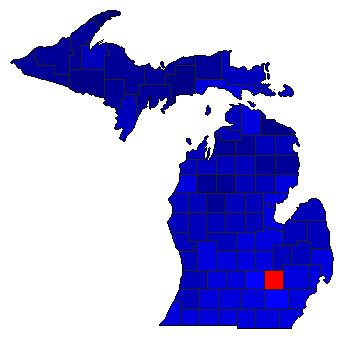
 | 1960 | 3,204,568 | 1 | 2 | 4 | 74,147 | 2.31% | 50.95% | 48.64% | 0.09% | 0.32% | 1,632,782 | 1,558,635 | 2,967 | 10,184 | |
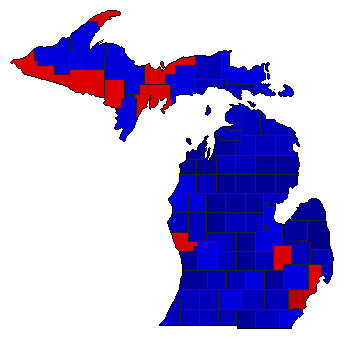
 | 1954 | 2,138,999 | 1 | 2 | 3 | 184,156 | 8.61% | 54.15% | 45.54% | 0.25% | 0.06% | 1,158,276 | 974,120 | 5,296 | 1,307 | |
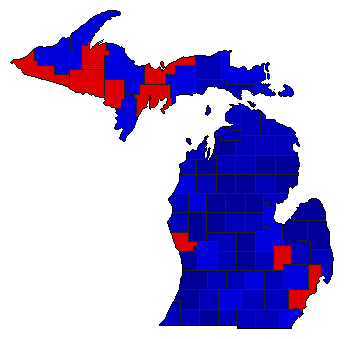
 | 1952 | 2,781,140 | 2 | 1 | 3 | 89,212 | 3.21% | 48.23% | 51.44% | 0.29% | 0.05% | 1,341,298 | 1,430,510 | 7,947 | 1,385 | |
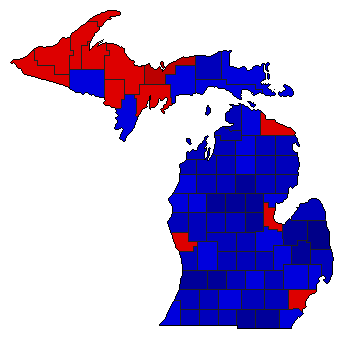
 | 1950 | 1,798,138 | 2 | 1 | 3 | 102,353 | 5.69% | 46.90% | 52.59% | 0.40% | 0.11% | 843,295 | 945,648 | 7,136 | 2,059 | |
 |  | 1938 | 1,535,052 | 2 | 1 | 3 | 98,517 | 6.42% | 46.59% | 53.01% | 0.18% | 0.21% | 715,227 | 813,744 | 2,813 | 3,268 |
 |  | 1908 | 538,717 | 2 | 1 | 3 | 133,798 | 24.84% | 34.97% | 59.81% | 3.03% | 2.19% | 188,412 | 322,210 | 16,314 | 11,781 |
Michigan Results for 1960
Login
© Dave Leip's Atlas of U.S. Elections, LLC 2019 All Rights Reserved
Note: The advertisement links below may advocate political positions that this site does not endorse.
Login
© Dave Leip's Atlas of U.S. Elections, LLC 2019 All Rights Reserved
Note: The advertisement links below may advocate political positions that this site does not endorse.