| Map | Pie | Office | Total | D | R | I | Margin | %Margin | Dem | Rep | Ind | Oth. | Dem | Rep | Ind | Other | | | | | | | | | | | | | | | | | | |
|---|
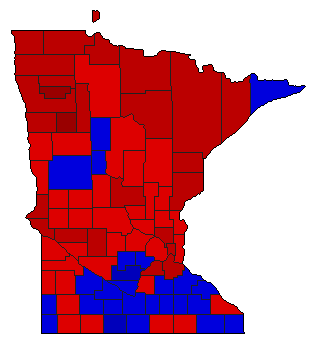
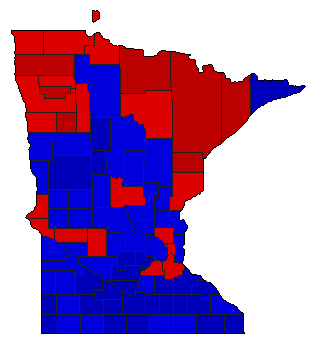
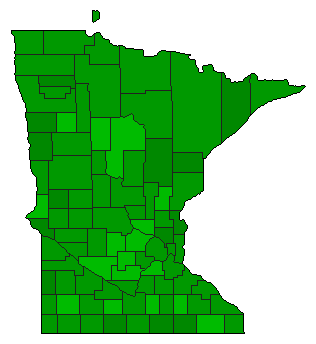
 |  | President |
1,541,887 |
1 |
2 |
0 |
22,018 |
1.43% |
50.58% |
49.16% |
0.00% |
0.26% |
779,933 |
757,915 |
0 |
4,039 |
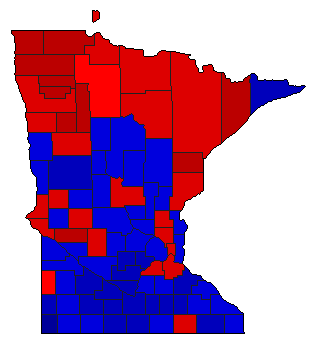
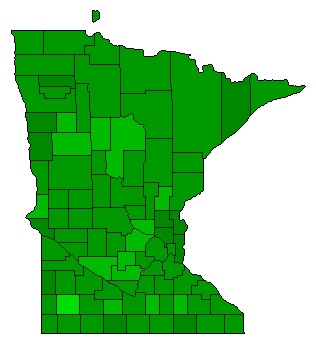
 | | Senator |
1,536,839 |
1 |
2 |
3 |
235,582 |
15.33% |
57.53% |
42.20% |
0.27% |
0.00% |
884,168 |
648,586 |
4,085 |
0 |
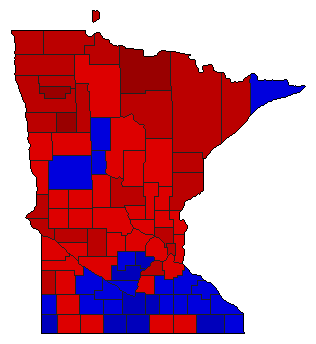
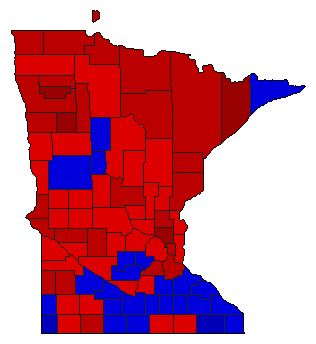
 | | Governor |
1,550,265 |
2 |
1 |
3 |
22,879 |
1.48% |
49.08% |
50.56% |
0.36% |
0.00% |
760,934 |
783,813 |
5,518 |
0 |
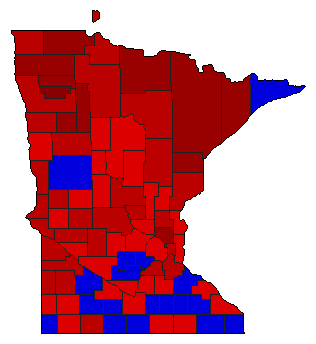
 |  | Lt. Governor |
1,494,405 |
1 |
2 |
0 |
151,441 |
10.13% |
55.07% |
44.93% |
0.00% |
0.00% |
822,923 |
671,482 |
0 |
0 |
 |  | Secretary of State |
1,503,581 |
1 |
2 |
0 |
279,201 |
18.57% |
59.28% |
40.72% |
0.00% |
0.00% |
891,391 |
612,190 |
0 |
0 |
 |  | State Treasurer |
1,504,348 |
2 |
1 |
0 |
84,982 |
5.65% |
47.18% |
52.82% |
0.00% |
0.00% |
709,683 |
794,665 |
0 |
0 |
 |  | Attorney General |
1,496,324 |
1 |
2 |
0 |
246,786 |
16.49% |
58.25% |
41.75% |
0.00% |
0.00% |
871,555 |
624,769 |
0 |
0 |
| | | Map | Pie | Initiative | Total Vote | N | | Y | Margin | %Margin | No | | Yes | Oth. | No | | Yes | |
 |  | Amendment |
1,264,863 |
2 |
0 |
1 |
262,005 |
20.71% |
39.64% |
0.00% |
60.36% |
0.00% |
501,429 |
0 |
763,434 |
0 |
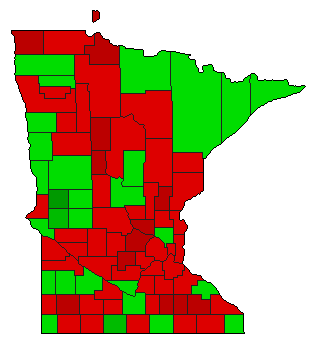 |  | Amendment |
1,261,806 |
1 |
0 |
2 |
60,212 |
4.77% |
52.39% |
0.00% |
47.61% |
0.00% |
661,009 |
0 |
600,797 |
0 |
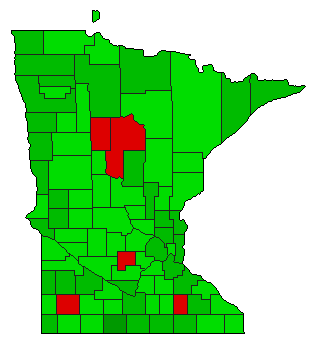
 |  | Amendment |
1,279,731 |
2 |
0 |
1 |
669,241 |
52.30% |
23.85% |
0.00% |
76.15% |
0.00% |
305,245 |
0 |
974,486 |
0 |
 |  | Amendment |
1,295,403 |
2 |
0 |
1 |
690,969 |
53.34% |
23.33% |
0.00% |
76.67% |
0.00% |
302,217 |
0 |
993,186 |
0 |
|
