1960 General Election Results Comparison - Montana
| Map | Pie | Office | Total | D | R | I | Margin | %Margin | Dem | Rep | Ind | Oth. | Dem | Rep | Ind | Other |
 |  | President | 277,579 | 2 | 1 | 0 | 6,950 | 2.50% | 48.60% | 51.10% | 0.00% | 0.31% | 134,891 | 141,841 | 0 | 847 |
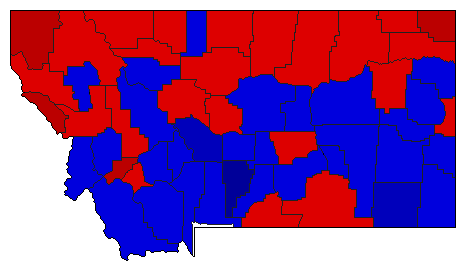 | Senator | 276,612 | 1 | 2 | 0 | 4,050 | 1.46% | 50.73% | 49.27% | 0.00% | 0.00% | 140,331 | 136,281 | 0 | 0 | |
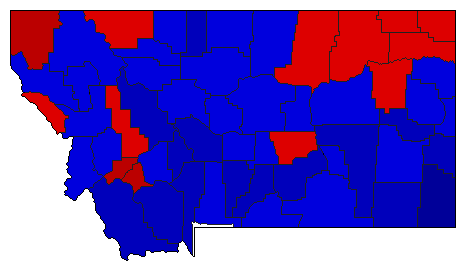 | Governor | 279,881 | 2 | 1 | 0 | 28,579 | 10.21% | 44.89% | 55.11% | 0.00% | 0.00% | 125,651 | 154,230 | 0 | 0 |
Montana Results for 1960
Login
© Dave Leip's Atlas of U.S. Elections, LLC 2019 All Rights Reserved
Note: The advertisement links below may advocate political positions that this site does not endorse.
Login
© Dave Leip's Atlas of U.S. Elections, LLC 2019 All Rights Reserved
Note: The advertisement links below may advocate political positions that this site does not endorse.