| Map | Pie | Office | Total | D | R | I | Margin | %Margin | Dem | Rep | Ind | Oth. | Dem | Rep | Ind | Other | | | | | | | | | | | | | | | | | | |
|---|
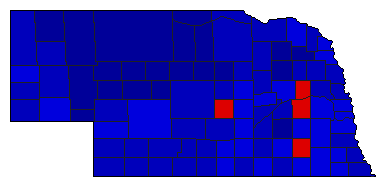
 |  | President |
613,095 |
2 |
1 |
0 |
148,011 |
24.14% |
37.93% |
62.07% |
0.00% |
0.00% |
232,542 |
380,553 |
0 |
0 |
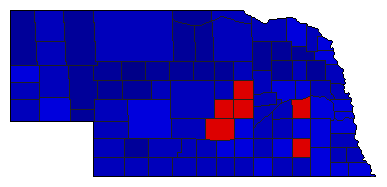
 |  | Senator |
598,743 |
2 |
1 |
0 |
106,911 |
17.86% |
41.06% |
58.91% |
0.00% |
0.03% |
245,837 |
352,748 |
0 |
158 |
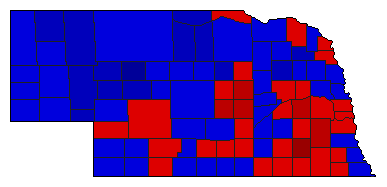 | | Governor |
598,971 |
1 |
2 |
0 |
24,042 |
4.01% |
51.98% |
47.97% |
0.00% |
0.05% |
311,344 |
287,302 |
0 |
325 |
 |  | Lt. Governor |
581,737 |
2 |
1 |
0 |
95,933 |
16.49% |
41.75% |
58.24% |
0.00% |
0.00% |
242,891 |
338,824 |
0 |
22 |
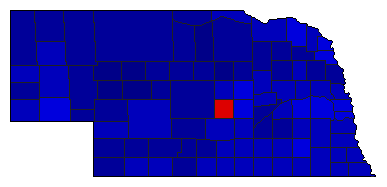 |  | Secretary of State |
576,149 |
2 |
1 |
0 |
158,005 |
27.42% |
36.29% |
63.71% |
0.00% |
0.00% |
209,070 |
367,075 |
0 |
4 |
 |  | State Treasurer |
568,285 |
2 |
1 |
0 |
44,410 |
7.81% |
46.09% |
53.91% |
0.00% |
0.00% |
261,937 |
306,347 |
0 |
1 |
 |  | Attorney General |
553,608 |
2 |
1 |
0 |
73,954 |
13.36% |
43.32% |
56.68% |
0.00% |
0.00% |
239,823 |
313,777 |
0 |
8 |
 |  | State Auditor |
561,149 |
2 |
1 |
0 |
127,293 |
22.68% |
38.66% |
61.34% |
0.00% |
0.00% |
216,927 |
344,220 |
0 |
2 |
|
