1960 General Election Results Comparison - North Carolina
| Map | Pie | Office | Total | D | R | I | Margin | %Margin | Dem | Rep | Ind | Oth. | Dem | Rep | Ind | Other |
 |  | President | 1,368,556 | 1 | 2 | 0 | 57,716 | 4.22% | 52.11% | 47.89% | 0.00% | 0.00% | 713,136 | 655,420 | 0 | 0 |
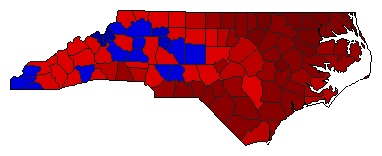 | Senator | 1,291,485 | 1 | 2 | 0 | 295,557 | 22.89% | 61.44% | 38.56% | 0.00% | 0.00% | 793,521 | 497,964 | 0 | 0 | |
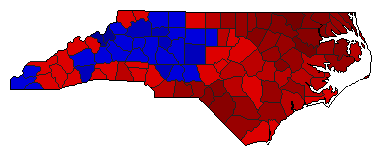 |  | Governor | 1,350,360 | 1 | 2 | 3 | 121,273 | 8.98% | 54.45% | 45.47% | 0.08% | 0.00% | 735,248 | 613,975 | 1,137 | 0 |
North Carolina Results for 1960
Login
© Dave Leip's Atlas of U.S. Elections, LLC 2019 All Rights Reserved
Note: The advertisement links below may advocate political positions that this site does not endorse.
Login
© Dave Leip's Atlas of U.S. Elections, LLC 2019 All Rights Reserved
Note: The advertisement links below may advocate political positions that this site does not endorse.