| Map | Pie | Office | Total | D | R | I | Margin | %Margin | Dem | Rep | Ind | Oth. | Dem | Rep | Ind | Other | | | | | | | | | | | | | | | | | | |
|---|
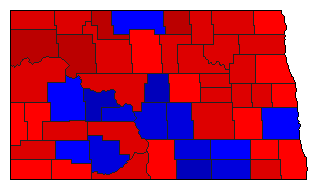
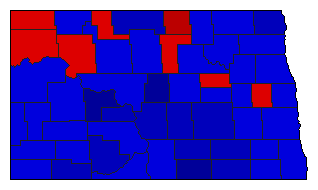
 |  | President |
278,431 |
2 |
1 |
0 |
30,347 |
10.90% |
44.52% |
55.42% |
0.00% |
0.06% |
123,963 |
154,310 |
0 |
158 |
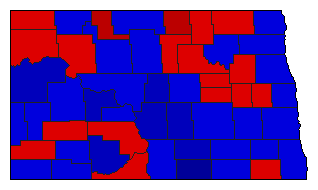
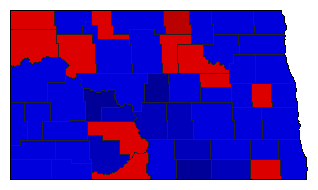
 | | Governor |
275,375 |
1 |
2 |
3 |
13,662 |
4.96% |
49.44% |
44.48% |
6.08% |
0.00% |
136,148 |
122,486 |
16,741 |
0 |
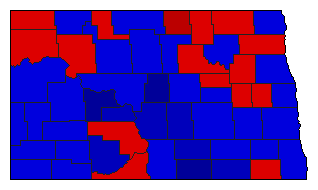
 |  | Lt. Governor |
257,753 |
2 |
1 |
0 |
12,977 |
5.03% |
47.48% |
52.52% |
0.00% |
0.00% |
122,388 |
135,365 |
0 |
0 |
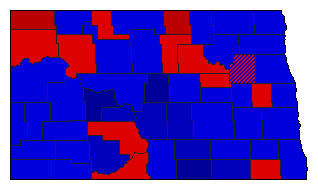
 |  | Secretary of State |
257,065 |
2 |
1 |
0 |
22,789 |
8.87% |
45.57% |
54.43% |
0.00% |
0.00% |
117,138 |
139,927 |
0 |
0 |
 |  | State Treasurer |
254,995 |
2 |
1 |
0 |
25,087 |
9.84% |
45.08% |
54.92% |
0.00% |
0.00% |
114,954 |
140,041 |
0 |
0 |
 |  | Attorney General |
259,294 |
2 |
1 |
0 |
30,938 |
11.93% |
44.03% |
55.97% |
0.00% |
0.00% |
114,178 |
145,116 |
0 |
0 |
 |  | State Auditor |
257,189 |
2 |
1 |
0 |
23,479 |
9.13% |
45.44% |
54.56% |
0.00% |
0.00% |
116,855 |
140,334 |
0 |
0 |
 |  | Insurance Commissioner |
254,755 |
2 |
1 |
0 |
33,835 |
13.28% |
43.36% |
56.64% |
0.00% |
0.00% |
110,460 |
144,295 |
0 |
0 |
 |  | Agriculture Commissioner |
259,377 |
2 |
1 |
0 |
24,771 |
9.55% |
45.22% |
54.78% |
0.00% |
0.00% |
117,303 |
142,074 |
0 |
0 |
|
