Note: The Google advertisement links below may advocate political positions that this site does not endorse.
| Map | Pie | Office | Total | D | R | I | Margin | %Margin | Dem | Rep | Ind | Oth. | Dem | Rep | Ind | Other | | | | | | | | | | | | | | | | | | |
|---|
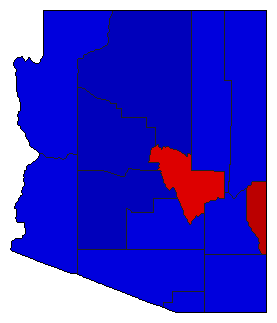
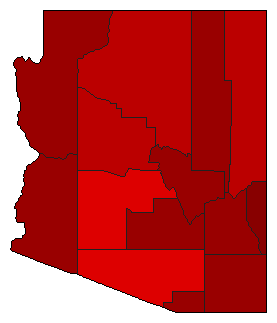
 |  | President |
398,491 |
2 |
1 |
0 |
44,460 |
11.16% |
44.36% |
55.52% |
0.00% |
0.12% |
176,781 |
221,241 |
0 |
469 |
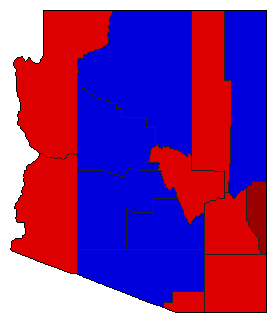
 | | Governor |
397,107 |
2 |
1 |
0 |
73,897 |
18.61% |
40.70% |
59.30% |
0.00% |
0.00% |
161,605 |
235,502 |
0 |
0 |
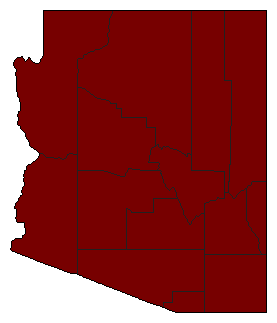 | | Secretary of State |
243,028 |
1 |
0 |
0 |
243,028 |
100.00% |
100.00% |
0.00% |
0.00% |
0.00% |
243,028 |
0 |
0 |
0 |
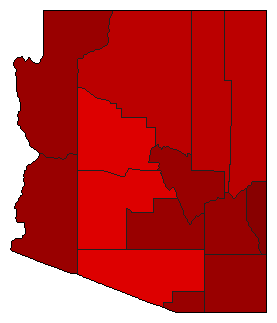 | | State Treasurer |
367,084 |
1 |
2 |
0 |
56,142 |
15.29% |
57.65% |
42.35% |
0.00% |
0.00% |
211,613 |
155,471 |
0 |
0 |
 | | Attorney General |
389,487 |
2 |
1 |
0 |
46,909 |
12.04% |
43.98% |
56.02% |
0.00% |
0.00% |
171,289 |
218,198 |
0 |
0 |
 | | State Auditor |
380,314 |
1 |
2 |
0 |
65,162 |
17.13% |
58.57% |
41.43% |
0.00% |
0.00% |
222,738 |
157,576 |
0 |
0 |
|
