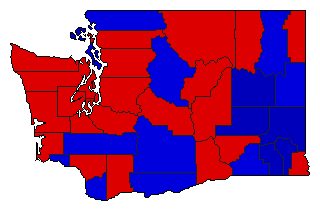
1960 General Election Results Comparison - Washington
| Map | Pie | Office | Total | D | R | I | Margin | %Margin | Dem | Rep | Ind | Oth. | Dem | Rep | Ind | Other |
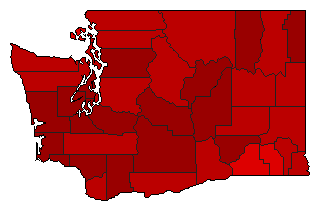
 |  | President | 1,241,572 | 2 | 1 | 0 | 29,975 | 2.41% | 48.27% | 50.68% | 0.00% | 1.05% | 599,298 | 629,273 | 0 | 13,001 |
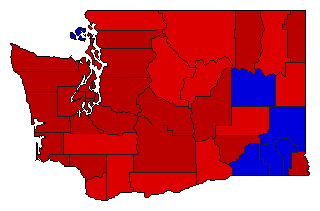
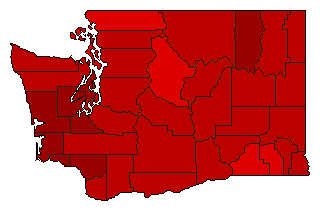
 | Governor | 1,215,748 | 1 | 2 | 0 | 17,865 | 1.47% | 50.34% | 48.87% | 0.00% | 0.79% | 611,987 | 594,122 | 0 | 9,639 | |
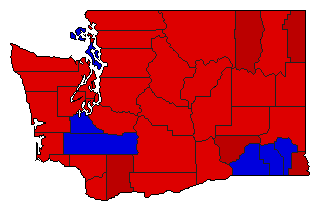
 | Lt. Governor | 1,135,267 | 1 | 2 | 0 | 315,141 | 27.76% | 63.88% | 36.12% | 0.00% | 0.00% | 725,204 | 410,063 | 0 | 0 | |
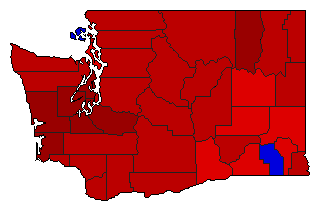
 | Secretary of State | 1,137,624 | 1 | 2 | 0 | 76,516 | 6.73% | 53.36% | 46.64% | 0.00% | 0.00% | 607,070 | 530,554 | 0 | 0 | |
 | State Treasurer | 1,089,570 | 1 | 2 | 0 | 264,732 | 24.30% | 62.15% | 37.85% | 0.00% | 0.00% | 677,151 | 412,419 | 0 | 0 | |
 | Attorney General | 1,088,929 | 1 | 2 | 0 | 351,841 | 32.31% | 66.16% | 33.84% | 0.00% | 0.00% | 720,385 | 368,544 | 0 | 0 | |
 |  | Comptroller General | 1,089,085 | 1 | 2 | 0 | 413,495 | 37.97% | 68.98% | 31.02% | 0.00% | 0.00% | 751,290 | 337,795 | 0 | 0 |
 | State Auditor | 1,114,206 | 1 | 2 | 0 | 318,596 | 28.59% | 64.30% | 35.70% | 0.00% | 0.00% | 716,401 | 397,805 | 0 | 0 | |
 | Insurance Commissioner | 1,061,385 | 1 | 2 | 0 | 188,643 | 17.77% | 58.89% | 41.11% | 0.00% | 0.00% | 625,014 | 436,371 | 0 | 0 | |
| Map | Pie | Initiative | Total Vote | N | Y | Margin | %Margin | No | Yes | Oth. | No | Yes | ||||
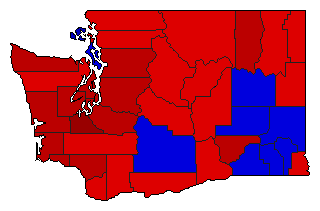
 | Initiative | 1,152,758 | 2 | 0 | 1 | 39,512 | 3.43% | 48.29% | 0.00% | 51.71% | 0.00% | 556,623 | 0 | 596,135 | 0 | |
Washington Results for 1960
Login
© Dave Leip's Atlas of U.S. Elections, LLC 2019 All Rights Reserved
Note: The advertisement links below may advocate political positions that this site does not endorse.
Login
© Dave Leip's Atlas of U.S. Elections, LLC 2019 All Rights Reserved
Note: The advertisement links below may advocate political positions that this site does not endorse.