1960 General Election Results Comparison - West Virginia
| Map | Pie | Office | Total | D | R | I | Margin | %Margin | Dem | Rep | Ind | Oth. | Dem | Rep | Ind | Other |
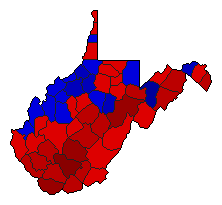
 |  | President | 837,781 | 1 | 2 | 0 | 45,791 | 5.47% | 52.73% | 47.27% | 0.00% | 0.00% | 441,786 | 395,995 | 0 | 0 |
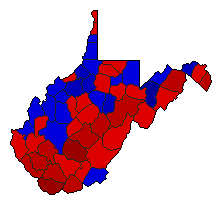
 | Senator | 818,292 | 1 | 2 | 0 | 98,420 | 12.03% | 56.01% | 43.99% | 0.00% | 0.00% | 458,355 | 359,935 | 0 | 2 | |
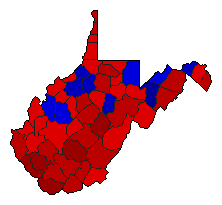
 | Governor | 827,420 | 1 | 2 | 0 | 66,090 | 7.99% | 53.99% | 46.01% | 0.00% | 0.00% | 446,755 | 380,665 | 0 | 0 | |
 | Secretary of State | 800,137 | 1 | 2 | 0 | 135,587 | 16.95% | 58.47% | 41.53% | 0.00% | 0.00% | 467,862 | 332,275 | 0 | 0 |
West Virginia Results for 1960
Login
© Dave Leip's Atlas of U.S. Elections, LLC 2019 All Rights Reserved
Note: The advertisement links below may advocate political positions that this site does not endorse.
Login
© Dave Leip's Atlas of U.S. Elections, LLC 2019 All Rights Reserved
Note: The advertisement links below may advocate political positions that this site does not endorse.