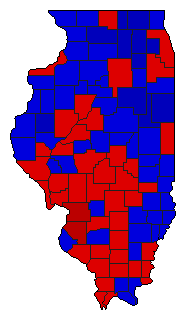
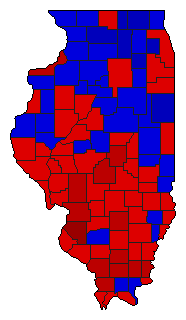
1964 General Election Results Comparison - Illinois
| Map | Pie | Office | Total | D | R | I | Margin | %Margin | Dem | Rep | Ind | Oth. | Dem | Rep | Ind | Other |
 |  | President | 4,702,841 | 1 | 2 | 0 | 890,887 | 18.94% | 59.47% | 40.53% | 0.00% | 0.00% | 2,796,833 | 1,905,946 | 0 | 62 |
 | Governor | 4,657,500 | 1 | 2 | 0 | 179,299 | 3.85% | 51.92% | 48.08% | 0.00% | 0.00% | 2,418,394 | 2,239,095 | 0 | 11 | |
 |  | Secretary of State | 4,545,912 | 1 | 2 | 0 | 488,556 | 10.75% | 55.37% | 44.63% | 0.00% | 0.00% | 2,517,226 | 2,028,670 | 0 | 16 |
Illinois Results for 1964
Login
© Dave Leip's Atlas of U.S. Elections, LLC 2019 All Rights Reserved
Note: The advertisement links below may advocate political positions that this site does not endorse.
Login
© Dave Leip's Atlas of U.S. Elections, LLC 2019 All Rights Reserved
Note: The advertisement links below may advocate political positions that this site does not endorse.