| Map | Pie | Year | Total | D | R | I | Margin | %Margin | Dem | Rep | Ind | Oth. | Dem | Rep | Ind | Other | | | | | | | | | | | | | | | | | | |
|---|
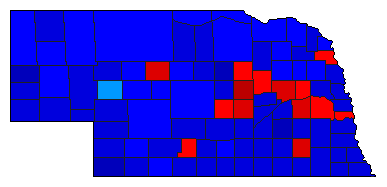
 | | 1978 |
492,423 |
2 |
1 |
0 |
58,719 |
11.92% |
44.02% |
55.94% |
0.00% |
0.04% |
216,754 |
275,473 |
0 |
196 |
 |  | 1970 |
446,539 |
2 |
1 |
0 |
66,458 |
14.88% |
42.56% |
57.44% |
0.00% |
0.01% |
190,029 |
256,487 |
0 |
23 |
 |  | 1966 |
467,283 |
2 |
1 |
0 |
103,068 |
22.06% |
38.97% |
61.03% |
0.00% |
0.01% |
182,095 |
285,163 |
0 |
25 |
 |  | 1964 |
561,710 |
1 |
2 |
0 |
8,315 |
1.48% |
50.74% |
49.26% |
0.00% |
0.00% |
285,003 |
276,688 |
0 |
19 |
 |  | 1962 |
448,978 |
2 |
1 |
0 |
94,988 |
21.16% |
39.42% |
60.58% |
0.00% |
0.00% |
176,990 |
271,978 |
0 |
10 |
 |  | 1960 |
581,737 |
2 |
1 |
0 |
95,933 |
16.49% |
41.75% |
58.24% |
0.00% |
0.00% |
242,891 |
338,824 |
0 |
22 |
 |  | 1958 |
400,145 |
2 |
1 |
0 |
4,446 |
1.11% |
49.44% |
50.56% |
0.00% |
0.00% |
197,849 |
202,295 |
0 |
1 |
 | | 1936 |
546,987 |
1 |
2 |
0 |
81,821 |
14.96% |
57.48% |
42.52% |
0.00% |
0.00% |
314,404 |
232,583 |
0 |
0 |
 |  | 1924 |
427,844 |
2 |
1 |
3 |
51,947 |
12.14% |
39.04% |
51.18% |
7.20% |
2.59% |
167,018 |
218,965 |
30,797 |
11,064 |
|
