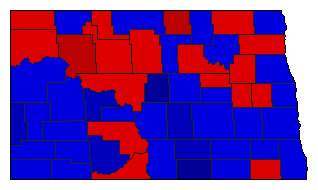
1964 General Election Results Comparison - North Dakota
| Map | Pie | Office | Total | D | R | I | Margin | %Margin | Dem | Rep | Ind | Oth. | Dem | Rep | Ind | Other |
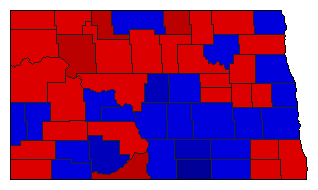
 |  | President | 258,389 | 1 | 2 | 0 | 41,577 | 16.09% | 57.97% | 41.88% | 0.00% | 0.15% | 149,784 | 108,207 | 0 | 398 |
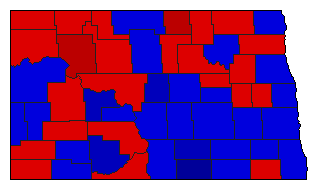
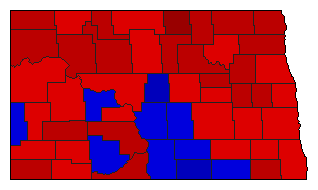 |  | Senator | 258,877 | 1 | 2 | 0 | 39,493 | 15.26% | 57.63% | 42.37% | 0.00% | 0.00% | 149,185 | 109,692 | 0 | 0 |
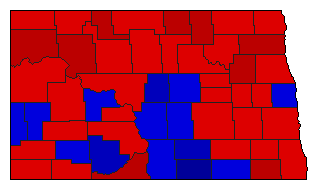
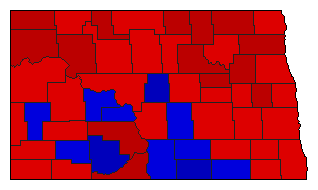 | Governor | 262,661 | 1 | 2 | 0 | 30,167 | 11.49% | 55.74% | 44.26% | 0.00% | 0.00% | 146,414 | 116,247 | 0 | 0 | |
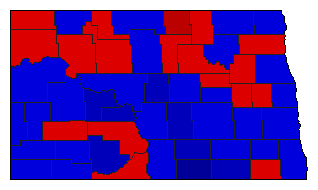
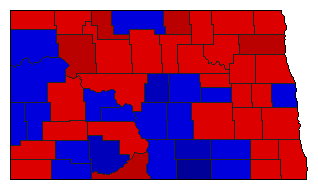 |  | Lt. Governor | 244,572 | 1 | 2 | 0 | 8,680 | 3.55% | 51.77% | 48.23% | 0.00% | 0.00% | 126,626 | 117,946 | 0 | 0 |
 |  | Secretary of State | 245,629 | 2 | 1 | 0 | 10,711 | 4.36% | 47.82% | 52.18% | 0.00% | 0.00% | 117,459 | 128,170 | 0 | 0 |
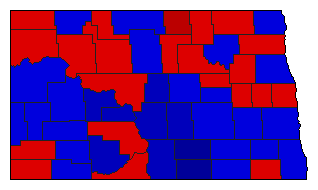
 |  | State Treasurer | 243,510 | 1 | 2 | 0 | 4,614 | 1.89% | 50.95% | 49.05% | 0.00% | 0.00% | 124,062 | 119,448 | 0 | 0 |
 |  | Attorney General | 243,943 | 2 | 1 | 0 | 4,501 | 1.85% | 49.08% | 50.92% | 0.00% | 0.00% | 119,721 | 124,222 | 0 | 0 |
 |  | State Auditor | 245,551 | 2 | 1 | 0 | 11,439 | 4.66% | 47.67% | 52.33% | 0.00% | 0.00% | 117,056 | 128,495 | 0 | 0 |
 |  | Insurance Commissioner | 243,783 | 1 | 2 | 0 | 15,595 | 6.40% | 53.20% | 46.80% | 0.00% | 0.00% | 129,689 | 114,094 | 0 | 0 |
 |  | Agriculture Commissioner | 243,292 | 2 | 1 | 0 | 9,854 | 4.05% | 47.97% | 52.03% | 0.00% | 0.00% | 116,719 | 126,573 | 0 | 0 |
North Dakota Results for 1964
Login
© Dave Leip's Atlas of U.S. Elections, LLC 2019 All Rights Reserved
Note: The advertisement links below may advocate political positions that this site does not endorse.
Login
© Dave Leip's Atlas of U.S. Elections, LLC 2019 All Rights Reserved
Note: The advertisement links below may advocate political positions that this site does not endorse.