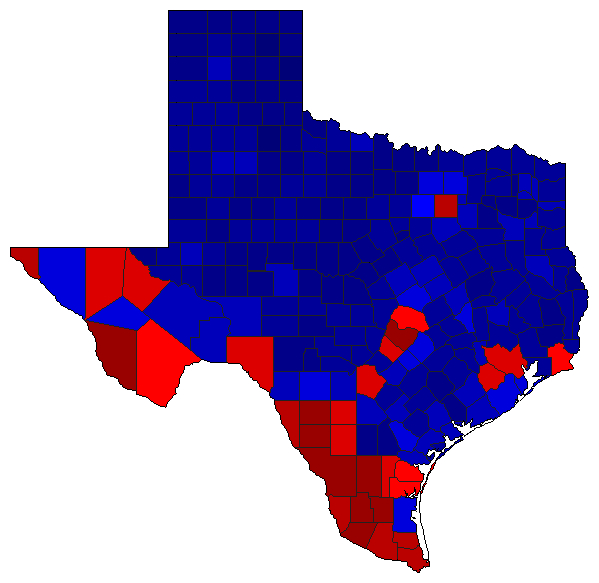
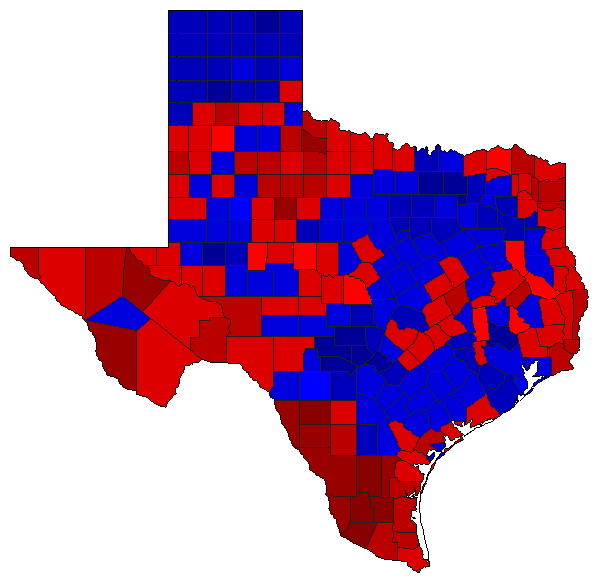
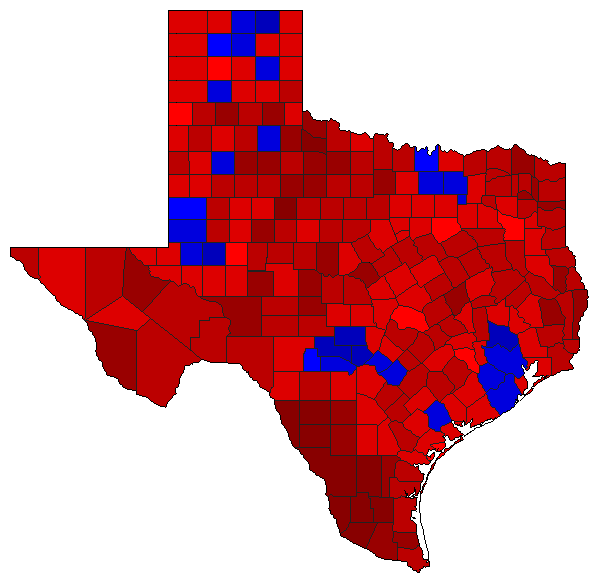
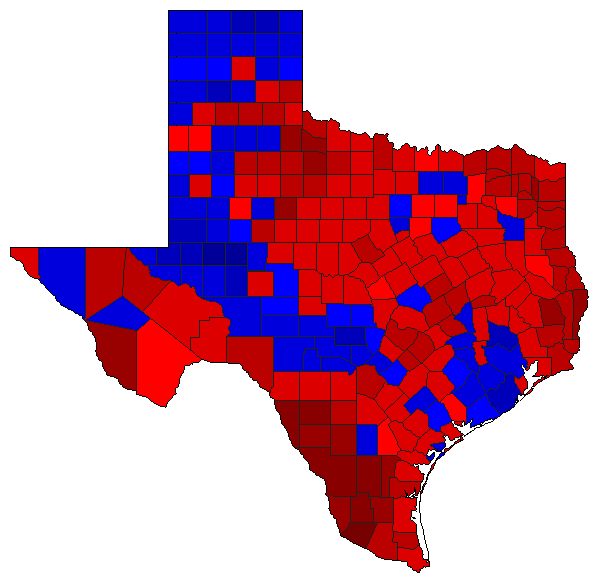
Attorney General General Election Results Comparison - Texas
| Map | Pie | Year | Total | D | R | I | Margin | %Margin | Dem | Rep | Ind | Oth. | Dem | Rep | Ind | Other |
 | 2022 | 8,010,003 | 2 | 1 | 0 | 781,719 | 9.76% | 43.66% | 53.42% | 0.00% | 2.92% | 3,497,267 | 4,278,986 | 0 | 233,750 | |
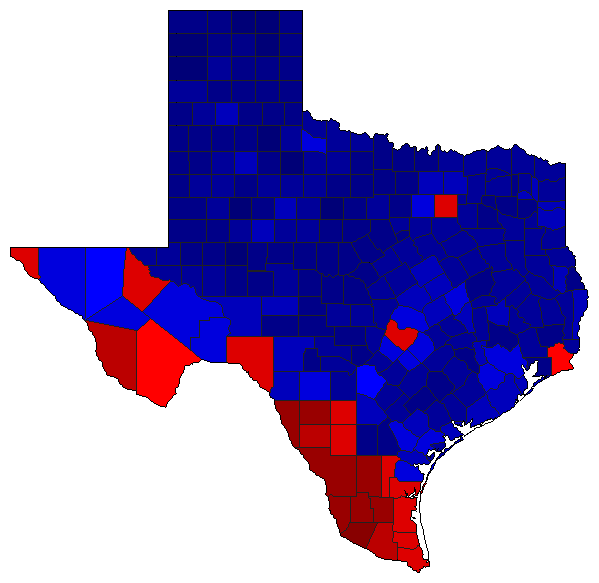
 |  | 2018 | 8,292,615 | 2 | 1 | 0 | 295,109 | 3.56% | 47.01% | 50.57% | 0.00% | 2.43% | 3,898,098 | 4,193,207 | 0 | 201,310 |
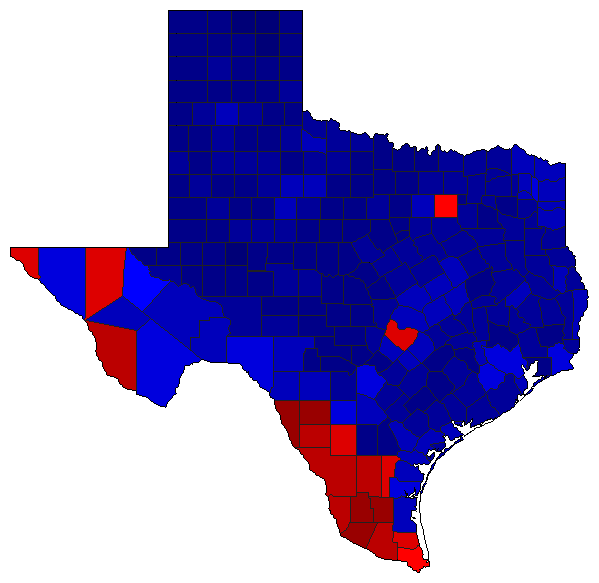
 |  | 2014 | 4,663,530 | 2 | 1 | 0 | 969,538 | 20.79% | 38.02% | 58.81% | 0.00% | 3.17% | 1,773,108 | 2,742,646 | 0 | 147,776 |
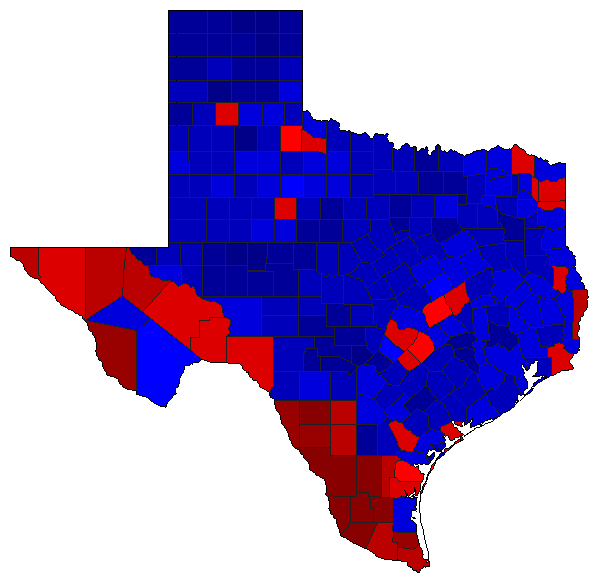
 | 2010 | 4,932,361 | 2 | 1 | 0 | 1,508,525 | 30.58% | 33.57% | 64.16% | 0.00% | 2.27% | 1,655,859 | 3,164,384 | 0 | 112,118 | |
 | 2006 | 4,294,800 | 2 | 1 | 3 | 956,994 | 22.28% | 37.23% | 59.52% | 3.25% | 0.00% | 1,599,069 | 2,556,063 | 139,668 | 0 | |
 | 2002 | 4,481,983 | 2 | 1 | 0 | 700,825 | 15.64% | 41.08% | 56.72% | 0.00% | 2.20% | 1,841,359 | 2,542,184 | 0 | 98,440 | |
 | 1998 | 3,691,443 | 2 | 1 | 0 | 371,749 | 10.07% | 44.18% | 54.26% | 0.00% | 1.56% | 1,631,045 | 2,002,794 | 0 | 57,604 | |
 | 1994 | 4,263,161 | 1 | 2 | 0 | 438,986 | 10.30% | 53.70% | 43.40% | 0.00% | 2.89% | 2,289,389 | 1,850,403 | 0 | 123,369 | |
 |  | 1990 | 3,782,331 | 1 | 2 | 0 | 255,608 | 6.76% | 51.92% | 45.16% | 0.00% | 2.92% | 1,963,714 | 1,708,106 | 0 | 110,511 |
 | 1964 | 2,543,172 | 1 | 2 | 0 | 1,258,904 | 49.50% | 74.75% | 25.25% | 0.00% | 0.00% | 1,901,038 | 642,134 | 0 | 0 |
Texas Results for 1964
Login
© Dave Leip's Atlas of U.S. Elections, LLC 2019 All Rights Reserved
Note: The advertisement links below may advocate political positions that this site does not endorse.
Login
© Dave Leip's Atlas of U.S. Elections, LLC 2019 All Rights Reserved
Note: The advertisement links below may advocate political positions that this site does not endorse.