1966 General Election Results Comparison - Minnesota
| Map | Pie | Office | Total | D | R | I | Margin | %Margin | Dem | Rep | Ind | Oth. | Dem | Rep | Ind | Other |
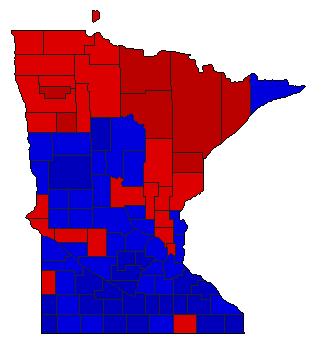
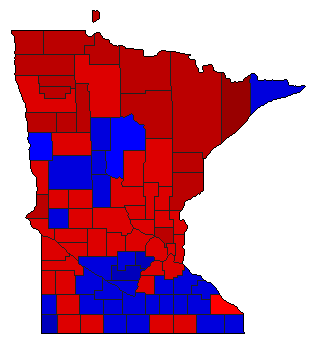 | Senator | 1,271,426 | 1 | 2 | 4 | 110,972 | 8.73% | 53.94% | 45.21% | 0.41% | 0.43% | 685,840 | 574,868 | 5,231 | 5,487 | |
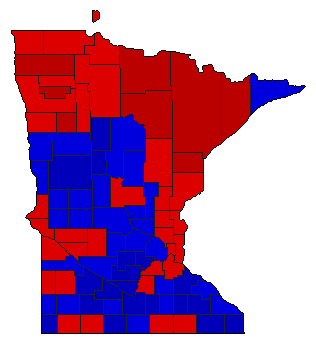
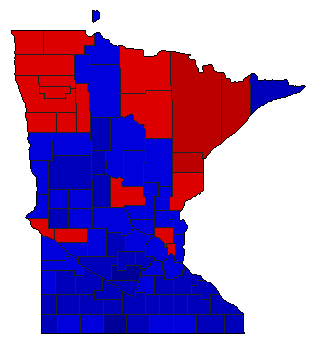
 | Governor | 1,295,058 | 2 | 1 | 3 | 72,650 | 5.61% | 46.94% | 52.55% | 0.50% | 0.00% | 607,943 | 680,593 | 6,522 | 0 | |
 |  | Lt. Governor | 1,267,613 | 2 | 1 | 0 | 27,027 | 2.13% | 48.93% | 51.07% | 0.00% | 0.00% | 620,293 | 647,320 | 0 | 0 |
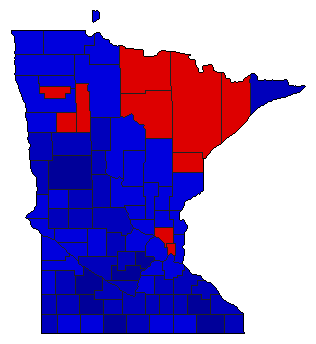
 |  | Secretary of State | 1,263,153 | 1 | 2 | 0 | 127,359 | 10.08% | 55.04% | 44.96% | 0.00% | 0.00% | 695,256 | 567,897 | 0 | 0 |
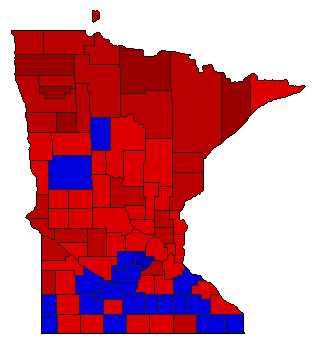
 |  | State Treasurer | 1,244,004 | 2 | 1 | 0 | 159,596 | 12.83% | 43.59% | 56.41% | 0.00% | 0.00% | 542,204 | 701,800 | 0 | 0 |
 |  | Attorney General | 1,254,906 | 2 | 1 | 0 | 80,942 | 6.45% | 46.77% | 53.23% | 0.00% | 0.00% | 586,982 | 667,924 | 0 | 0 |
 |  | State Auditor | 1,253,231 | 2 | 1 | 0 | 131,341 | 10.48% | 44.76% | 55.24% | 0.00% | 0.00% | 560,945 | 692,286 | 0 | 0 |
Minnesota Results for 1966
Login
© Dave Leip's Atlas of U.S. Elections, LLC 2019 All Rights Reserved
Note: The advertisement links below may advocate political positions that this site does not endorse.
Login
© Dave Leip's Atlas of U.S. Elections, LLC 2019 All Rights Reserved
Note: The advertisement links below may advocate political positions that this site does not endorse.