| Map | Pie | Office | Total | D | R | I | Margin | %Margin | Dem | Rep | Ind | Oth. | Dem | Rep | Ind | Other | | | | | | | | | | | | | | | | | | |
|---|
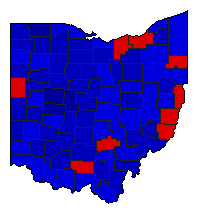
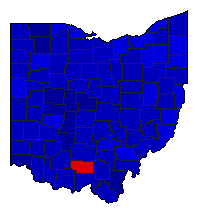 |  | Governor |
2,887,331 |
2 |
1 |
0 |
703,223 |
24.36% |
37.82% |
62.18% |
0.00% |
0.00% |
1,092,054 |
1,795,277 |
0 |
0 |
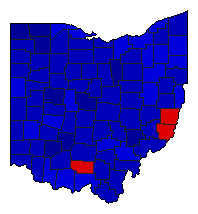 |  | Lt. Governor |
2,732,710 |
2 |
1 |
0 |
562,644 |
20.59% |
39.71% |
60.29% |
0.00% |
0.00% |
1,085,033 |
1,647,677 |
0 |
0 |
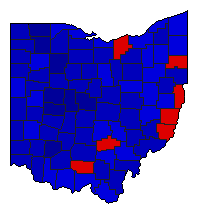
 |  | Secretary of State |
2,712,310 |
2 |
1 |
0 |
636,890 |
23.48% |
38.26% |
61.74% |
0.00% |
0.00% |
1,037,710 |
1,674,600 |
0 |
0 |
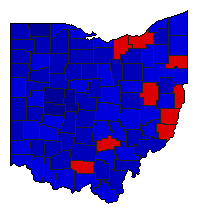
 |  | State Treasurer |
2,662,850 |
2 |
1 |
0 |
471,338 |
17.70% |
41.15% |
58.85% |
0.00% |
0.00% |
1,095,756 |
1,567,094 |
0 |
0 |
 |  | Attorney General |
2,755,843 |
2 |
1 |
0 |
288,233 |
10.46% |
44.77% |
55.23% |
0.00% |
0.00% |
1,233,805 |
1,522,038 |
0 |
0 |
 |  | State Auditor |
2,724,453 |
2 |
1 |
0 |
330,893 |
12.15% |
43.93% |
56.07% |
0.00% |
0.00% |
1,196,780 |
1,527,673 |
0 |
0 |
|
