| Map | Pie | Office | Total | D | R | I | Margin | %Margin | Dem | Rep | Ind | Oth. | Dem | Rep | Ind | Other | | | | | | | | | | | | | | | | | | |
|---|
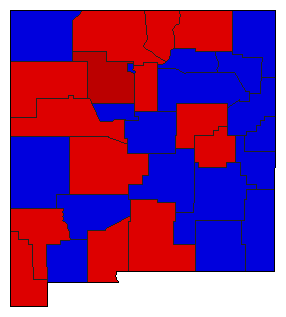
 |  | President |
327,281 |
2 |
1 |
3 |
39,611 |
12.10% |
39.75% |
51.85% |
7.86% |
0.54% |
130,081 |
169,692 |
25,737 |
1,771 |
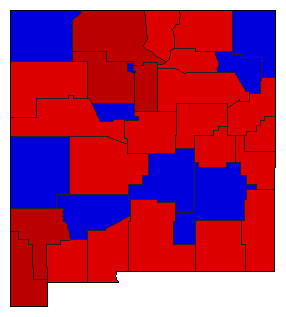
 |  | Governor |
318,910 |
2 |
1 |
0 |
2,910 |
0.91% |
49.30% |
50.21% |
0.00% |
0.48% |
157,230 |
160,140 |
0 |
1,540 |
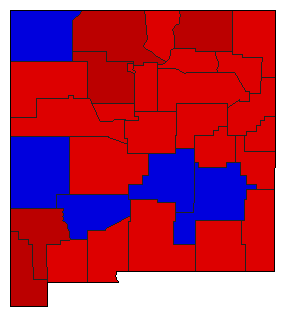
 |  | Secretary of State |
304,901 |
1 |
2 |
0 |
9,292 |
3.05% |
51.12% |
48.07% |
0.00% |
0.81% |
155,860 |
146,568 |
0 |
2,473 |
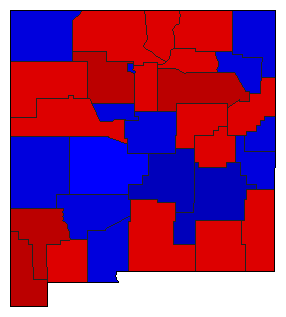
 |  | State Treasurer |
297,394 |
1 |
2 |
0 |
6,078 |
2.04% |
50.54% |
48.49% |
0.00% |
0.97% |
150,294 |
144,216 |
0 |
2,884 |
 |  | Attorney General |
300,497 |
1 |
2 |
0 |
22,385 |
7.45% |
53.72% |
46.28% |
0.00% |
0.00% |
161,441 |
139,056 |
0 |
0 |
 |  | State Auditor |
297,304 |
2 |
1 |
0 |
765 |
0.26% |
49.42% |
49.68% |
0.00% |
0.90% |
146,935 |
147,700 |
0 |
2,669 |
|


