| Map | Pie | Office | Total | D | R | I | Margin | %Margin | Dem | Rep | Ind | Oth. | Dem | Rep | Ind | Other | | | | | | | | | | | | | | | | | | |
|---|
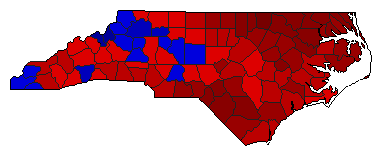
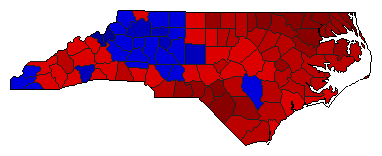
 |  | President |
1,587,493 |
3 |
1 |
2 |
131,004 |
8.25% |
29.24% |
39.51% |
31.26% |
0.00% |
464,113 |
627,192 |
496,188 |
0 |
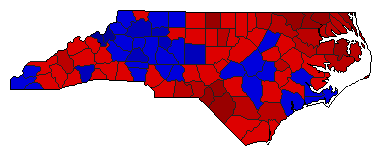
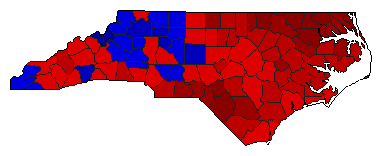
 |  | Senator |
1,437,340 |
1 |
2 |
0 |
303,472 |
21.11% |
60.56% |
39.44% |
0.00% |
0.00% |
870,406 |
566,934 |
0 |
0 |
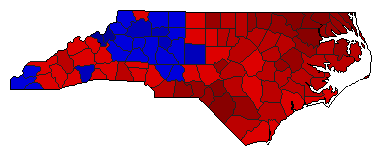
 | | Governor |
1,558,308 |
1 |
2 |
0 |
84,158 |
5.40% |
52.70% |
47.30% |
0.00% |
0.00% |
821,233 |
737,075 |
0 |
0 |
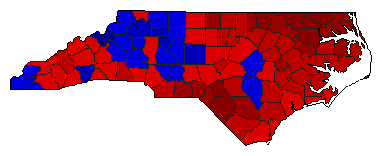
 |  | Lt. Governor |
1,448,598 |
1 |
2 |
0 |
155,312 |
10.72% |
55.36% |
44.64% |
0.00% |
0.00% |
801,955 |
646,643 |
0 |
0 |
 |  | Secretary of State |
1,429,501 |
1 |
2 |
0 |
155,311 |
10.86% |
55.43% |
44.57% |
0.00% |
0.00% |
792,406 |
637,095 |
0 |
0 |
 |  | State Treasurer |
1,412,119 |
1 |
2 |
0 |
165,065 |
11.69% |
55.84% |
44.16% |
0.00% |
0.00% |
788,592 |
623,527 |
0 |
0 |
 |  | Attorney General |
1,414,542 |
1 |
2 |
0 |
181,798 |
12.85% |
56.43% |
43.57% |
0.00% |
0.00% |
798,170 |
616,372 |
0 |
0 |
 |  | State Auditor |
1,402,724 |
1 |
2 |
0 |
152,620 |
10.88% |
55.44% |
44.56% |
0.00% |
0.00% |
777,672 |
625,052 |
0 |
0 |
 |  | Insurance Commissioner |
1,419,673 |
1 |
2 |
0 |
168,489 |
11.87% |
55.93% |
44.07% |
0.00% |
0.00% |
794,081 |
625,592 |
0 |
0 |
 |  | Agriculture Commissioner |
1,408,211 |
1 |
2 |
0 |
166,147 |
11.80% |
55.90% |
44.10% |
0.00% |
0.00% |
787,179 |
621,032 |
0 |
0 |
|
