1968 General Election Results Comparison - North Dakota
| Map | Pie | Office | Total | D | R | I | Margin | %Margin | Dem | Rep | Ind | Oth. | Dem | Rep | Ind | Other |
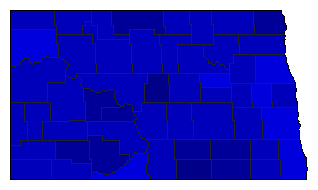
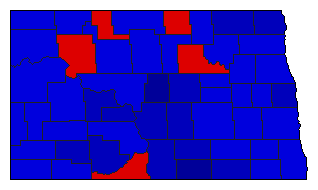
 |  | President | 247,882 | 2 | 1 | 3 | 43,900 | 17.71% | 38.23% | 55.94% | 5.75% | 0.08% | 94,769 | 138,669 | 14,244 | 200 |
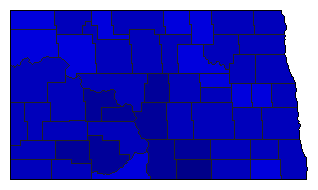
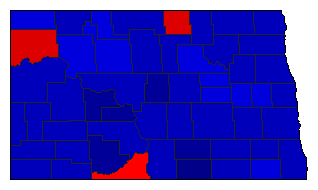
 |  | Senator | 239,776 | 2 | 1 | 0 | 74,153 | 30.93% | 33.70% | 64.63% | 0.00% | 1.67% | 80,815 | 154,968 | 0 | 3,993 |
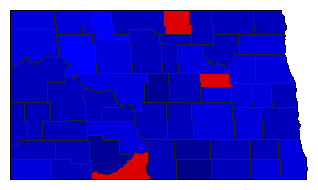
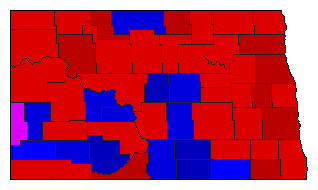 | Governor | 248,000 | 1 | 2 | 3 | 27,573 | 11.12% | 54.82% | 43.70% | 1.48% | 0.00% | 135,955 | 108,382 | 3,663 | 0 | |
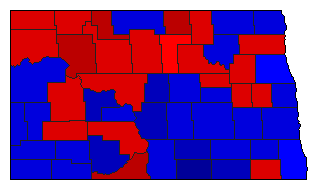
 |  | Lt. Governor | 233,947 | 2 | 1 | 0 | 13,206 | 5.64% | 46.44% | 52.09% | 0.00% | 1.47% | 108,647 | 121,853 | 0 | 3,447 |
 |  | Secretary of State | 228,638 | 2 | 1 | 0 | 68,945 | 30.15% | 34.19% | 64.35% | 0.00% | 1.46% | 78,176 | 147,121 | 0 | 3,341 |
 |  | State Treasurer | 225,021 | 2 | 1 | 0 | 5,739 | 2.55% | 47.97% | 50.53% | 0.00% | 1.50% | 107,953 | 113,692 | 0 | 3,376 |
 |  | Attorney General | 229,787 | 2 | 1 | 0 | 31,687 | 13.79% | 43.11% | 56.89% | 0.00% | 0.00% | 99,050 | 130,737 | 0 | 0 |
 |  | State Auditor | 227,465 | 2 | 1 | 0 | 60,121 | 26.43% | 36.08% | 62.51% | 0.00% | 1.42% | 82,061 | 142,182 | 0 | 3,222 |
 |  | Insurance Commissioner | 223,816 | 2 | 1 | 0 | 2,865 | 1.28% | 48.56% | 49.84% | 0.00% | 1.59% | 108,695 | 111,560 | 0 | 3,561 |
 |  | Agriculture Commissioner | 226,288 | 2 | 1 | 0 | 50,646 | 22.38% | 38.03% | 60.41% | 0.00% | 1.56% | 86,053 | 136,699 | 0 | 3,536 |
North Dakota Results for 1968
Login
© Dave Leip's Atlas of U.S. Elections, LLC 2019 All Rights Reserved
Note: The advertisement links below may advocate political positions that this site does not endorse.
Login
© Dave Leip's Atlas of U.S. Elections, LLC 2019 All Rights Reserved
Note: The advertisement links below may advocate political positions that this site does not endorse.