Note: The Google advertisement links below may advocate political positions that this site does not endorse.
| Map | Pie | Office | Total | D | R | I | Margin | %Margin | Dem | Rep | Ind | Oth. | Dem | Rep | Ind | Other | | | | | | | | | | | | | | | | | | |
|---|
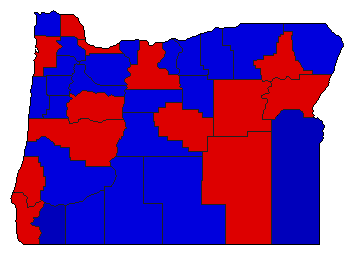
 |  | President |
819,622 |
2 |
1 |
3 |
49,567 |
6.05% |
43.78% |
49.83% |
6.06% |
0.32% |
358,866 |
408,433 |
49,683 |
2,640 |
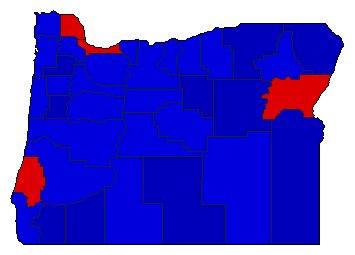
 | | Senator |
813,999 |
2 |
1 |
0 |
3,293 |
0.40% |
49.80% |
50.20% |
0.00% |
0.00% |
405,353 |
408,646 |
0 |
0 |
 |  | Secretary of State |
796,656 |
2 |
1 |
0 |
65,062 |
8.17% |
45.91% |
54.08% |
0.00% |
0.00% |
365,778 |
430,840 |
0 |
38 |
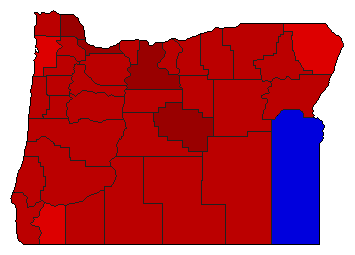 |  | State Treasurer |
785,619 |
1 |
2 |
0 |
277,866 |
35.37% |
67.68% |
32.31% |
0.00% |
0.00% |
531,735 |
253,869 |
0 |
15 |
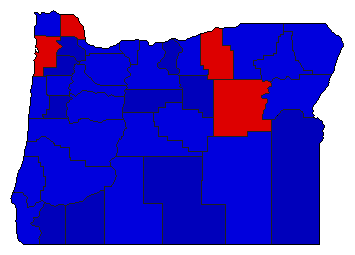 |  | Attorney General |
795,923 |
2 |
1 |
0 |
79,804 |
10.03% |
44.99% |
55.01% |
0.00% |
0.00% |
358,046 |
437,850 |
0 |
27 |
|
