1968 General Election Results Comparison - Pennsylvania
| Map | Pie | Office | Total | D | R | I | Margin | %Margin | Dem | Rep | Ind | Oth. | Dem | Rep | Ind | Other |
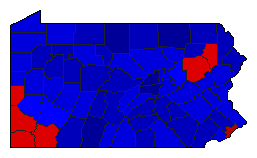
 |  | President | 4,747,928 | 1 | 2 | 3 | 169,388 | 3.57% | 47.59% | 44.02% | 7.97% | 0.42% | 2,259,405 | 2,090,017 | 378,582 | 19,924 |
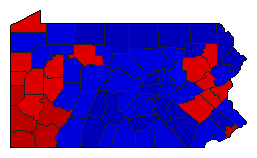
 | Senator | 4,624,107 | 2 | 1 | 3 | 282,100 | 6.10% | 45.80% | 51.90% | 2.09% | 0.21% | 2,117,662 | 2,399,762 | 96,742 | 9,941 | |
 |  | State Treasurer | 4,529,923 | 1 | 2 | 0 | 199,996 | 4.41% | 51.42% | 47.01% | 0.00% | 1.57% | 2,329,335 | 2,129,339 | 0 | 71,249 |
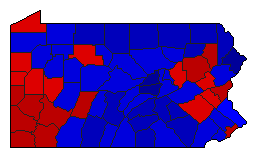 |  | State Auditor | 4,533,111 | 1 | 2 | 0 | 444,144 | 9.80% | 54.09% | 44.29% | 0.00% | 1.63% | 2,451,789 | 2,007,645 | 0 | 73,677 |
Pennsylvania Results for 1968
Login
© Dave Leip's Atlas of U.S. Elections, LLC 2019 All Rights Reserved
Note: The advertisement links below may advocate political positions that this site does not endorse.
Login
© Dave Leip's Atlas of U.S. Elections, LLC 2019 All Rights Reserved
Note: The advertisement links below may advocate political positions that this site does not endorse.