1968 General Election Results Comparison - California
| Map | Pie | Office | Total | D | R | I | Margin | %Margin | Dem | Rep | Ind | Oth. | Dem | Rep | Ind | Other |
 |  | President | 7,251,587 | 2 | 1 | 3 | 223,346 | 3.08% | 44.74% | 47.82% | 6.72% | 0.72% | 3,244,318 | 3,467,664 | 487,270 | 52,335 |
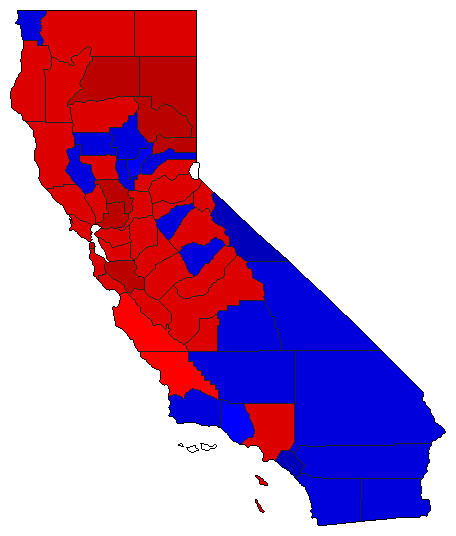 | Senator | 7,102,465 | 1 | 2 | 0 | 351,204 | 4.94% | 51.82% | 46.87% | 0.00% | 1.31% | 3,680,352 | 3,329,148 | 0 | 92,965 |
California Results for 1968
Login
© Dave Leip's Atlas of U.S. Elections, LLC 2019 All Rights Reserved
Note: The advertisement links below may advocate political positions that this site does not endorse.
Login
© Dave Leip's Atlas of U.S. Elections, LLC 2019 All Rights Reserved
Note: The advertisement links below may advocate political positions that this site does not endorse.