| Map | Pie | Office | Total | D | R | I | Margin | %Margin | Dem | Rep | Ind | Oth. | Dem | Rep | Ind | Other | | | | | | | | | | | | | | | | | | |
|---|
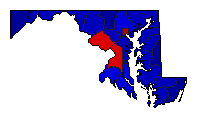
| | President |
956,370 |
2 |
1 |
3 |
24,538 |
2.57% |
48.14% |
50.71% |
1.15% |
0.00% |
460,422 |
484,960 |
10,988 |
0 |
 | | Senator |
956,370 |
2 |
1 |
3 |
24,538 |
2.57% |
48.14% |
50.71% |
1.15% |
0.00% |
460,422 |
484,960 |
10,988 |
0 |
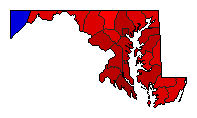
 | | Governor |
973,099 |
1 |
2 |
3 |
325,243 |
33.42% |
65.73% |
32.30% |
1.97% |
0.00% |
639,579 |
314,336 |
19,184 |
0 |
 |  | Lt. Governor |
792,107 |
1 |
2 |
3 |
235,786 |
29.77% |
63.65% |
33.88% |
2.47% |
0.00% |
504,167 |
268,381 |
19,559 |
0 |
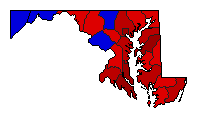 |  | Attorney General |
857,467 |
1 |
2 |
0 |
187,659 |
21.89% |
60.94% |
39.06% |
0.00% |
0.00% |
522,563 |
334,904 |
0 |
0 |
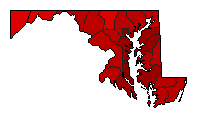 |  | Comptroller General |
873,371 |
1 |
2 |
0 |
342,853 |
39.26% |
69.63% |
30.37% |
0.00% |
0.00% |
608,112 |
265,259 |
0 |
0 |
|
