1970 General Election Results Comparison - Minnesota
| Map | Pie | Office | Total | D | R | I | Margin | %Margin | Dem | Rep | Ind | Oth. | Dem | Rep | Ind | Other |
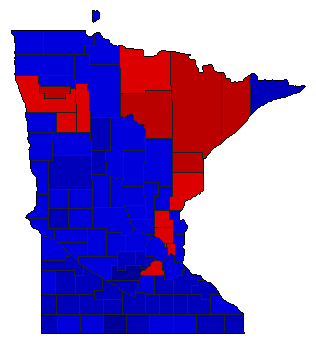
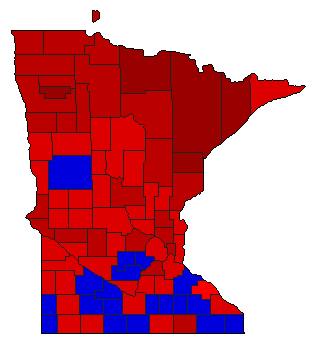 | Senator | 1,364,887 | 1 | 2 | 3 | 220,231 | 16.14% | 57.75% | 41.62% | 0.45% | 0.18% | 788,256 | 568,025 | 6,122 | 2,484 | |
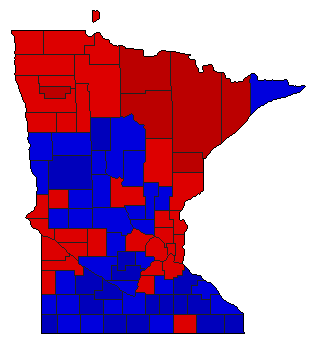
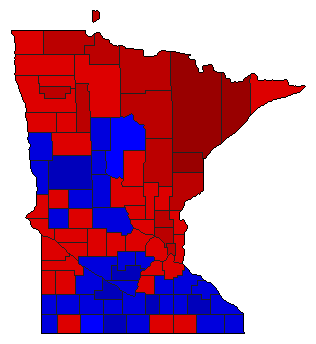 | Governor | 1,365,443 | 1 | 2 | 3 | 116,141 | 8.51% | 54.04% | 45.54% | 0.35% | 0.07% | 737,921 | 621,780 | 4,781 | 961 | |
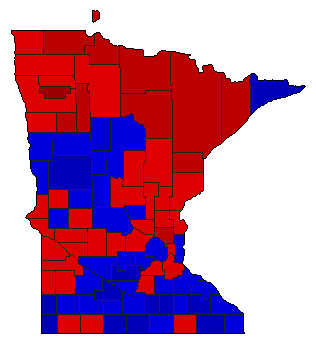 |  | Lt. Governor | 1,327,163 | 1 | 2 | 0 | 16,191 | 1.22% | 50.61% | 49.39% | 0.00% | 0.00% | 671,677 | 655,486 | 0 | 0 |
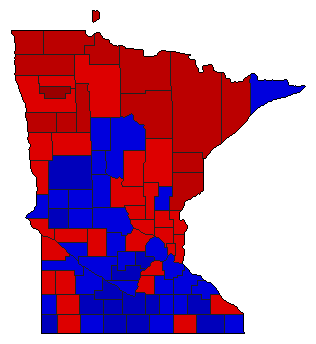 |  | Secretary of State | 1,324,447 | 2 | 1 | 0 | 10,141 | 0.77% | 49.62% | 50.38% | 0.00% | 0.00% | 657,153 | 667,294 | 0 | 0 |
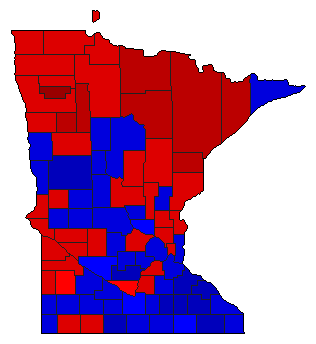
 |  | State Treasurer | 1,311,139 | 2 | 1 | 0 | 121,115 | 9.24% | 45.38% | 54.62% | 0.00% | 0.00% | 595,012 | 716,127 | 0 | 0 |
 |  | Attorney General | 1,324,814 | 1 | 2 | 0 | 35,944 | 2.71% | 51.36% | 48.64% | 0.00% | 0.00% | 680,379 | 644,435 | 0 | 0 |
 |  | State Auditor | 1,311,168 | 2 | 1 | 0 | 9,733 | 0.74% | 49.14% | 49.88% | 0.00% | 0.97% | 644,341 | 654,074 | 0 | 12,753 |
Minnesota Results for 1970
Login
© Dave Leip's Atlas of U.S. Elections, LLC 2019 All Rights Reserved
Note: The advertisement links below may advocate political positions that this site does not endorse.
Login
© Dave Leip's Atlas of U.S. Elections, LLC 2019 All Rights Reserved
Note: The advertisement links below may advocate political positions that this site does not endorse.