| Map | Pie | Office | Total | D | R | I | Margin | %Margin | Dem | Rep | Ind | Oth. | Dem | Rep | Ind | Other | | | | | | | | | | | | | | | | | | |
|---|
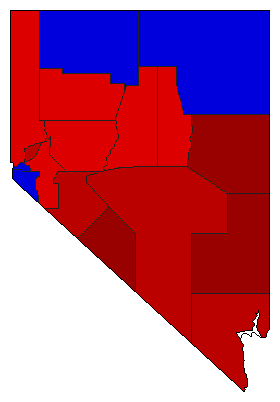
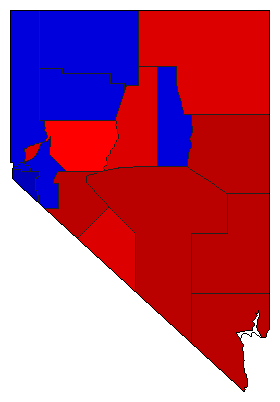 | | Senator |
147,768 |
1 |
2 |
3 |
24,349 |
16.48% |
57.65% |
41.17% |
1.18% |
0.00% |
85,187 |
60,838 |
1,743 |
0 |
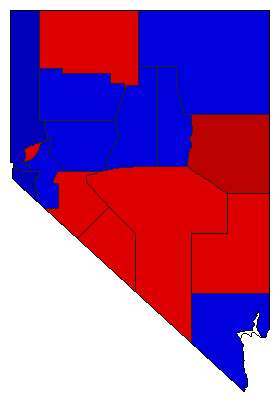
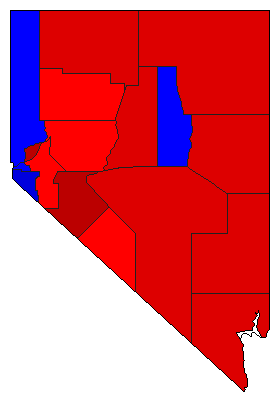 | | Governor |
146,991 |
1 |
2 |
4 |
6,297 |
4.28% |
48.10% |
43.81% |
3.68% |
4.41% |
70,697 |
64,400 |
5,415 |
6,479 |
 | | Lt. Governor |
144,072 |
1 |
2 |
0 |
13,916 |
9.66% |
54.83% |
45.17% |
0.00% |
0.00% |
78,994 |
65,078 |
0 |
0 |
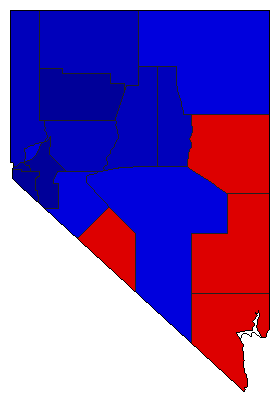
 | | Secretary of State |
131,841 |
1 |
2 |
0 |
53,463 |
40.55% |
70.28% |
29.72% |
0.00% |
0.00% |
92,652 |
39,189 |
0 |
0 |
 | | State Treasurer |
137,964 |
1 |
2 |
0 |
25,648 |
18.59% |
59.30% |
40.70% |
0.00% |
0.00% |
81,806 |
56,158 |
0 |
0 |
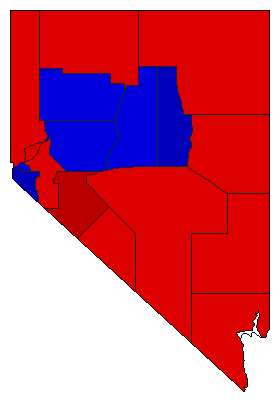
 | | Attorney General |
138,989 |
2 |
1 |
0 |
15,941 |
11.47% |
44.27% |
55.73% |
0.00% |
0.00% |
61,524 |
77,465 |
0 |
0 |
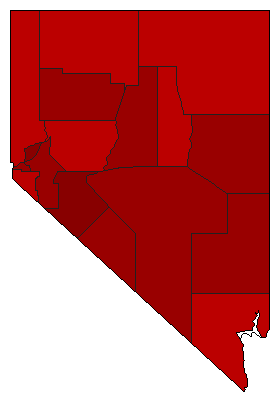
 | | Controller |
127,534 |
2 |
1 |
0 |
15,634 |
12.26% |
43.87% |
56.13% |
0.00% |
0.00% |
55,950 |
71,584 |
0 |
0 |
|
