| Map | Pie | Office | Total | D | R | I | Margin | %Margin | Dem | Rep | Ind | Oth. | Dem | Rep | Ind | Other | | | | | | | | | | | | | | | | | | |
|---|
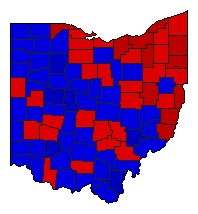
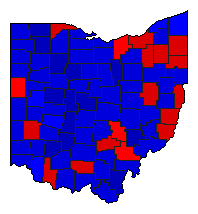 |  | Senator |
3,151,274 |
2 |
1 |
0 |
70,420 |
2.23% |
47.45% |
49.68% |
0.00% |
2.87% |
1,495,262 |
1,565,682 |
0 |
90,330 |
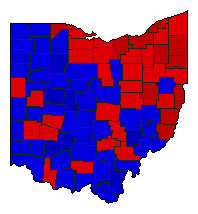
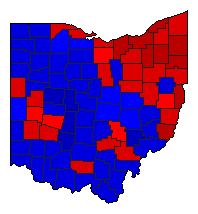 |  | Governor |
3,184,133 |
1 |
2 |
0 |
342,901 |
10.77% |
54.19% |
43.42% |
0.00% |
2.38% |
1,725,560 |
1,382,659 |
0 |
75,914 |
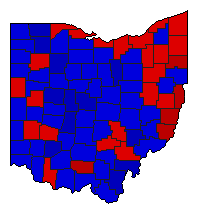
 |  | Lt. Governor |
2,954,580 |
2 |
1 |
0 |
155,186 |
5.25% |
47.37% |
52.62% |
0.00% |
0.00% |
1,399,651 |
1,554,837 |
0 |
92 |
 |  | Secretary of State |
2,968,961 |
2 |
1 |
0 |
244,879 |
8.25% |
45.88% |
54.12% |
0.00% |
0.00% |
1,362,041 |
1,606,920 |
0 |
0 |
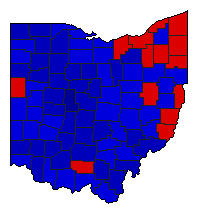
 |  | State Treasurer |
2,863,429 |
1 |
2 |
0 |
320,489 |
11.19% |
55.60% |
44.40% |
0.00% |
0.00% |
1,591,959 |
1,271,470 |
0 |
0 |
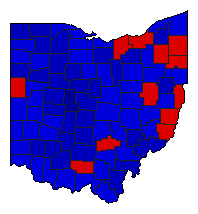
 |  | Attorney General |
2,911,441 |
1 |
2 |
0 |
316,505 |
10.87% |
55.43% |
44.56% |
0.00% |
0.00% |
1,613,926 |
1,297,421 |
0 |
94 |
 |  | State Auditor |
2,918,715 |
1 |
2 |
0 |
50,505 |
1.73% |
50.87% |
49.13% |
0.00% |
0.00% |
1,484,610 |
1,434,105 |
0 |
0 |
|
