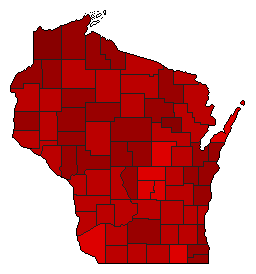
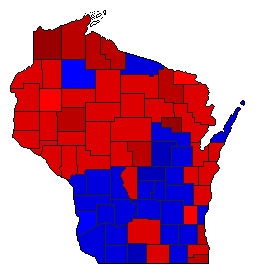
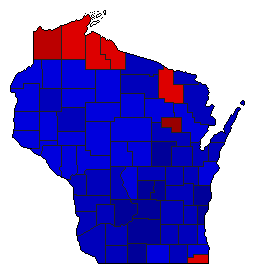
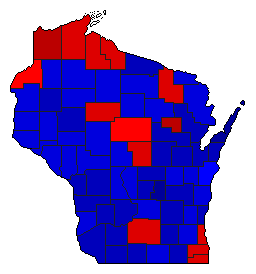
1970 General Election Results Comparison - Wisconsin
| Map | Pie | Office | Total | D | R | I | Margin | %Margin | Dem | Rep | Ind | Oth. | Dem | Rep | Ind | Other |
 | Senator | 1,338,909 | 1 | 2 | 0 | 567,148 | 42.36% | 70.84% | 28.48% | 0.00% | 0.68% | 948,445 | 381,297 | 0 | 9,167 | |
 | Governor | 1,342,858 | 1 | 2 | 3 | 125,786 | 9.37% | 54.24% | 44.88% | 0.67% | 0.21% | 728,403 | 602,617 | 9,035 | 2,803 | |
 | Secretary of State | 1,302,949 | 2 | 1 | 0 | 316,418 | 24.28% | 37.42% | 61.71% | 0.00% | 0.87% | 487,584 | 804,002 | 0 | 11,363 | |
 | State Treasurer | 1,266,456 | 1 | 2 | 0 | 57,260 | 4.52% | 51.82% | 47.30% | 0.00% | 0.87% | 656,325 | 599,065 | 0 | 11,066 | |
 | Attorney General | 1,288,492 | 2 | 1 | 0 | 93,163 | 7.23% | 46.08% | 53.31% | 0.00% | 0.60% | 593,775 | 686,938 | 0 | 7,779 |
Wisconsin Results for 1970
Login
© Dave Leip's Atlas of U.S. Elections, LLC 2019 All Rights Reserved
Note: The advertisement links below may advocate political positions that this site does not endorse.
Login
© Dave Leip's Atlas of U.S. Elections, LLC 2019 All Rights Reserved
Note: The advertisement links below may advocate political positions that this site does not endorse.