1972 General Election Results Comparison - Iowa
| Map | Pie | Office | Total | D | R | I | Margin | %Margin | Dem | Rep | Ind | Oth. | Dem | Rep | Ind | Other |
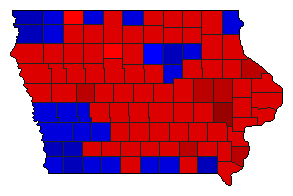
 |  | President | 1,225,944 | 2 | 1 | - | 210,001 | 17.13% | 40.48% | 57.61% | 0.00% | 1.92% | 496,206 | 706,207 | 0 | 23,531 |
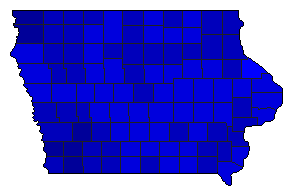
 | Senator | 1,203,319 | 1 | 2 | 3 | 132,112 | 10.98% | 55.07% | 44.09% | 0.74% | 0.10% | 662,637 | 530,525 | 8,954 | 1,203 | |
 | Governor | 1,210,223 | 2 | 1 | 3 | 219,894 | 18.17% | 40.26% | 58.43% | 1.30% | 0.00% | 487,283 | 707,177 | 15,715 | 48 | |
| Map | Pie | Initiative | Total Vote | N | Y | Margin | %Margin | No | Yes | Oth. | No | Yes | ||||
 | Initiative | 872,905 | 2 | 0 | 1 | 298,987 | 34.25% | 32.87% | 0.00% | 67.13% | 0.00% | 286,959 | 0 | 585,946 | 0 | |
Iowa Results for 1972
Login
© Dave Leip's Atlas of U.S. Elections, LLC 2019 All Rights Reserved
Note: The advertisement links below may advocate political positions that this site does not endorse.
Login
© Dave Leip's Atlas of U.S. Elections, LLC 2019 All Rights Reserved
Note: The advertisement links below may advocate political positions that this site does not endorse.