| Map | Pie | Office | Total | D | R | I | Margin | %Margin | Dem | Rep | Ind | Oth. | Dem | Rep | Ind | Other | | | | | | | | | | | | | | | | | | |
|---|
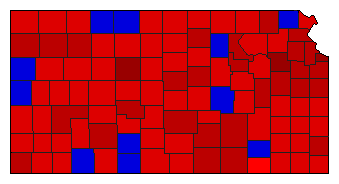
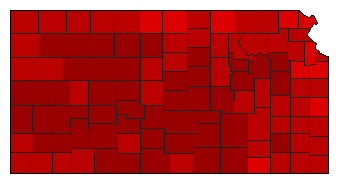
 |  | President |
916,095 |
2 |
1 |
- |
349,525 |
38.15% |
29.50% |
67.66% |
0.00% |
2.84% |
270,287 |
619,812 |
0 |
25,996 |
 |  | Senator |
871,722 |
2 |
1 |
0 |
421,827 |
48.39% |
23.03% |
71.42% |
0.00% |
5.55% |
200,764 |
622,591 |
0 |
48,367 |
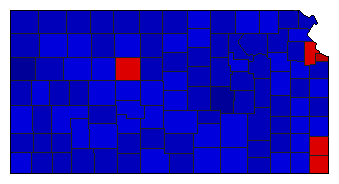
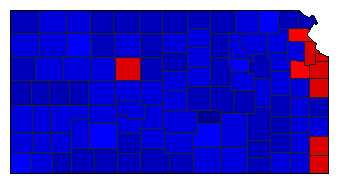
 |  | Governor |
921,552 |
1 |
2 |
0 |
229,816 |
24.94% |
61.99% |
37.05% |
0.00% |
0.96% |
571,256 |
341,440 |
0 |
8,856 |
 |  | Lt. Governor |
861,138 |
2 |
1 |
0 |
138,204 |
16.05% |
40.86% |
56.91% |
0.00% |
2.23% |
351,869 |
490,073 |
0 |
19,196 |
 |  | Secretary of State |
845,948 |
2 |
1 |
0 |
111,192 |
13.14% |
42.24% |
55.38% |
0.00% |
2.38% |
357,291 |
468,483 |
0 |
20,174 |
 |  | State Treasurer |
827,351 |
2 |
1 |
0 |
112,155 |
13.56% |
41.83% |
55.38% |
0.00% |
2.79% |
346,041 |
458,196 |
0 |
23,114 |
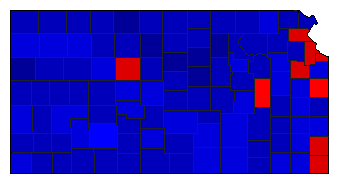
 |  | Attorney General |
889,573 |
1 |
2 |
0 |
316,661 |
35.60% |
67.80% |
32.20% |
0.00% |
0.00% |
603,117 |
286,456 |
0 |
0 |
 |  | State Auditor |
804,739 |
2 |
1 |
0 |
62,745 |
7.80% |
44.29% |
52.09% |
0.00% |
3.62% |
356,436 |
419,181 |
0 |
29,122 |
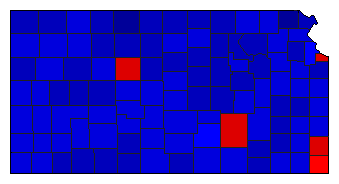
 |  | Insurance Commissioner |
809,645 |
2 |
1 |
0 |
229,641 |
28.36% |
34.05% |
62.41% |
0.00% |
3.54% |
275,661 |
505,302 |
0 |
28,682 |
|
