1972 General Election Results Comparison - Pennsylvania
| Map | Pie | Office | Total | D | R | I | Margin | %Margin | Dem | Rep | Ind | Oth. | Dem | Rep | Ind | Other |
 |  | President | 4,592,105 | 2 | 1 | - | 917,570 | 19.98% | 39.13% | 59.11% | 0.00% | 1.76% | 1,796,951 | 2,714,521 | 0 | 80,633 |
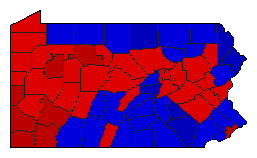 |  | State Treasurer | 4,381,838 | 1 | 2 | 0 | 274,473 | 6.26% | 52.44% | 46.18% | 0.00% | 1.38% | 2,297,851 | 2,023,378 | 0 | 60,609 |
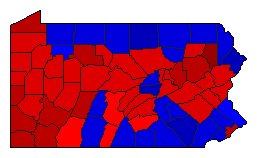 |  | State Auditor | 4,421,178 | 1 | 2 | 0 | 530,847 | 12.01% | 55.39% | 43.38% | 0.00% | 1.22% | 2,448,938 | 1,918,091 | 0 | 54,149 |
Pennsylvania Results for 1972
Login
© Dave Leip's Atlas of U.S. Elections, LLC 2019 All Rights Reserved
Note: The advertisement links below may advocate political positions that this site does not endorse.
Login
© Dave Leip's Atlas of U.S. Elections, LLC 2019 All Rights Reserved
Note: The advertisement links below may advocate political positions that this site does not endorse.