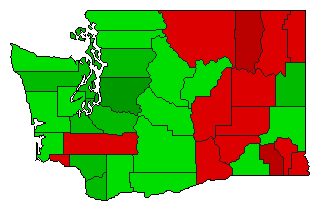
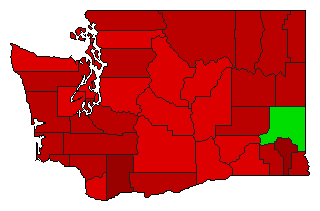
Referendum General Election Results Comparison - Washington
| Map | Pie | Year | Total | D | R | I | Margin | %Margin | Dem | Rep | Ind | Oth. | Dem | Rep | Ind | Other |
 | 2010 | 2,461,099 | 2 | 0 | 1 | 1,703,831 | 69.23% | 15.38% | 0.00% | 84.62% | 0.00% | 378,634 | 0 | 2,082,465 | 0 | |
 | 2008 | 2,914,506 | 2 | 0 | 1 | 1,313,040 | 45.05% | 27.47% | 0.00% | 72.53% | 0.00% | 800,733 | 0 | 2,113,773 | 0 | |
 | 1973 | 976,116 | 2 | 0 | 1 | 251,726 | 25.79% | 37.11% | 0.00% | 62.89% | 0.00% | 362,195 | 0 | 613,921 | 0 | |
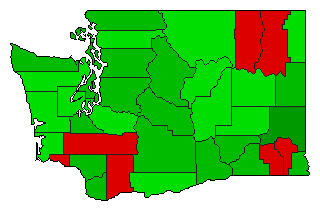 | 1972 | 1,316,536 | 2 | 0 | 1 | 337,618 | 25.64% | 37.18% | 0.00% | 62.82% | 0.00% | 489,459 | 0 | 827,077 | 0 | |
 | 1970 | 974,497 | 1 | 0 | 2 | 175,277 | 17.99% | 58.99% | 0.00% | 41.01% | 0.00% | 574,887 | 0 | 399,610 | 0 |
Washington Results for 1972
Login
© Dave Leip's Atlas of U.S. Elections, LLC 2019 All Rights Reserved
Note: The advertisement links below may advocate political positions that this site does not endorse.
Login
© Dave Leip's Atlas of U.S. Elections, LLC 2019 All Rights Reserved
Note: The advertisement links below may advocate political positions that this site does not endorse.