Referendum General Election Results Comparison - Washington
| Map | Pie | Year | Total | D | R | I | Margin | %Margin | Dem | Rep | Ind | Oth. | Dem | Rep | Ind | Other |
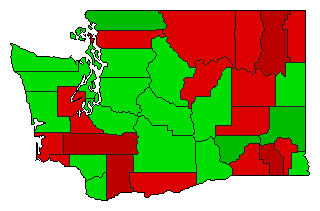 | 1972 | 1,328,884 | 2 | 0 | 1 | 140,540 | 10.58% | 44.71% | 0.00% | 55.29% | 0.00% | 594,172 | 0 | 734,712 | 0 |
Washington Results for 1972
Login
© Dave Leip's Atlas of U.S. Elections, LLC 2019 All Rights Reserved
Note: The advertisement links below may advocate political positions that this site does not endorse.
Login
© Dave Leip's Atlas of U.S. Elections, LLC 2019 All Rights Reserved
Note: The advertisement links below may advocate political positions that this site does not endorse.