1972 General Election Results Comparison - West Virginia
| Map | Pie | Office | Total | D | R | I | Margin | %Margin | Dem | Rep | Ind | Oth. | Dem | Rep | Ind | Other |
 |  | President | 762,399 | 2 | 1 | - | 207,529 | 27.22% | 36.39% | 63.61% | 0.00% | 0.00% | 277,435 | 484,964 | 0 | 0 |
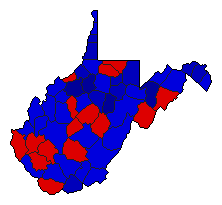
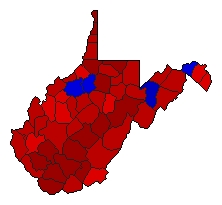 | Senator | 731,841 | 1 | 2 | 0 | 240,779 | 32.90% | 66.45% | 33.55% | 0.00% | 0.00% | 486,310 | 245,531 | 0 | 0 | |
 | Governor | 774,279 | 2 | 1 | 0 | 73,355 | 9.47% | 45.26% | 54.74% | 0.00% | 0.00% | 350,462 | 423,817 | 0 | 0 | |
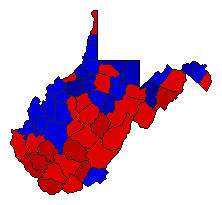 | Secretary of State | 696,433 | 2 | 1 | 0 | 2,911 | 0.42% | 49.79% | 50.21% | 0.00% | 0.00% | 346,761 | 349,672 | 0 | 0 |
West Virginia Results for 1972
Login
© Dave Leip's Atlas of U.S. Elections, LLC 2019 All Rights Reserved
Note: The advertisement links below may advocate political positions that this site does not endorse.
Login
© Dave Leip's Atlas of U.S. Elections, LLC 2019 All Rights Reserved
Note: The advertisement links below may advocate political positions that this site does not endorse.