1974 General Election Results Comparison - New Mexico
| Map | Pie | Office | Total | D | R | I | Margin | %Margin | Dem | Rep | Ind | Oth. | Dem | Rep | Ind | Other |
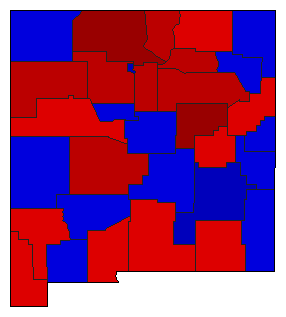
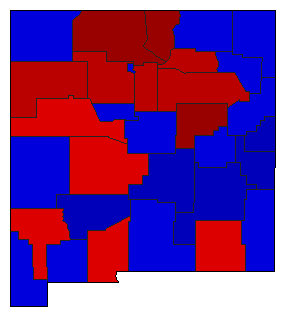 |  | Governor | 328,664 | 1 | 2 | 3 | 3,742 | 1.14% | 49.95% | 48.81% | 1.24% | 0.00% | 164,172 | 160,430 | 4,062 | 0 |
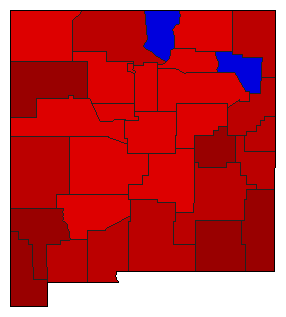 |  | Secretary of State | 310,416 | 1 | 2 | 0 | 51,290 | 16.52% | 58.26% | 41.74% | 0.00% | 0.00% | 180,853 | 129,563 | 0 | 0 |
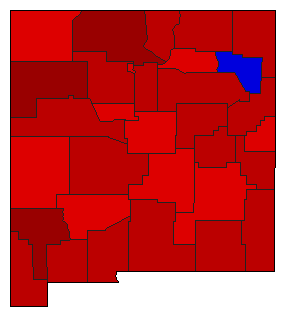 |  | State Treasurer | 296,484 | 1 | 2 | 0 | 67,868 | 22.89% | 61.45% | 38.55% | 0.00% | 0.00% | 182,176 | 114,308 | 0 | 0 |
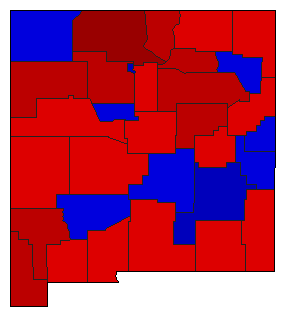 |  | Attorney General | 308,584 | 1 | 2 | 0 | 6,342 | 2.06% | 51.03% | 48.97% | 0.00% | 0.00% | 157,463 | 151,121 | 0 | 0 |
 |  | State Auditor | 301,663 | 1 | 2 | 0 | 18,929 | 6.27% | 53.14% | 46.86% | 0.00% | 0.00% | 160,296 | 141,367 | 0 | 0 |
New Mexico Results for 1974
Login
© Dave Leip's Atlas of U.S. Elections, LLC 2019 All Rights Reserved
Note: The advertisement links below may advocate political positions that this site does not endorse.
Login
© Dave Leip's Atlas of U.S. Elections, LLC 2019 All Rights Reserved
Note: The advertisement links below may advocate political positions that this site does not endorse.